Download
1 / 25
270 likes | 507 Vues
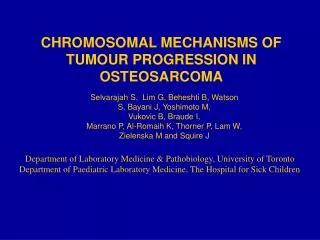
CHROMOSOMAL MECHANISMS OF TUMOUR PROGRESSION IN OSTEOSARCOMA. Selvarajah S, Lim G, Beheshti B, Watson S, Bayani J, Yoshimoto M, Vukovic B, Braude I, Marrano P, Al-Romaih K, Thorner P, Lam W, Zielenska M and Squire J.

E N D
CHROMOSOMAL MECHANISMS OF TUMOUR PROGRESSION IN OSTEOSARCOMA Selvarajah S, Lim G, Beheshti B, Watson S, Bayani J, Yoshimoto M, Vukovic B, Braude I, Marrano P, Al-Romaih K, Thorner P, Lam W, Zielenska M and Squire J Department of Laboratory Medicine & Pathobiology, University of Toronto Department of Paediatric Laboratory Medicine, The Hospital for Sick Children
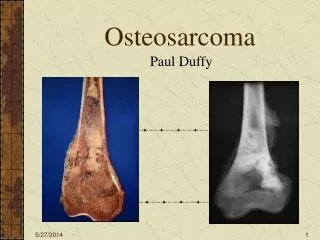
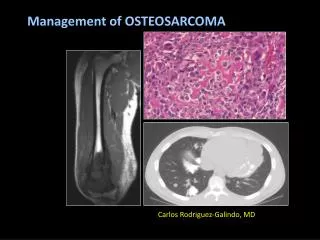
OSTEOSARCOMA • Osteosarcoma (OS) – most common (20%) of primary bone tumors • Bimodal distribution – 75% in young patients <20 yrs • Defined according to – • matrix production, location, histology, grade • Conventional OS • mostly high-grade, aneuploid
BACKGROUND: Adapted from Mills and Fechner, 1993, and www.cancer.org
Complex karyotypes – different for each case CYTOGENETICS OF OS: Hypertetraploid – proximal tibia (9 year old female)
SPECTRAL KARYOTYPING (SKY) Allows Simultaneous visualization
Examples of SKY analysis of OS • A-C: inverted DAPI and RGB images of chromosomes are illustrated • D: only SKY-classified colours are illustrated • A: aberrations involving chr. 8 • B: evolution of new rearrangements • C: aberrations involving chr. 20 • D: SKY analysis of OS9
SKY ANALYSIS: • Analysis and positional mapping of recurrent breakpoint regions reveal ‘hotspots’ for rearrangement (10 OS tumours & 4 OS cell lines) Bayani et al., 2003 Summary of SKY and met.CGH in OS
Saos-2 Centrosome aberrations common in OS
DEAC FITC Texas Red Cy5 Spectrum Orange Experimental Techniques mBAND FISH
OBSERVATIONS: COMPLICONS in OS mBAND analysis shows pattern of interspersal gain of 6p21, 8q24 and 9p22. Ladder amplification pattern. Indicates co-amplification & co-translocation of non-syntenic regions (6p21.3-p22.1, 8q24 and 9p21-p22)
BAC Array CGH – MG-63 6p21.3 ~6 Mb 8q24 ~32 Mb Chr 9 9p21~22 ~17 Mb
Amplification of drug resistance genes has been shown to generate • markers bearing ladder-like amplicons • Breakage-fusion-bridge mechanism is employed to acquire resistance via • oncogene amplification Complicon organization in MG-63 marker chromosome Coquelle et al., 1997 Bridge-Breakage-Fusion (BFB)
The distinct ladder pattern observed in the MG-63 marker chromosome suggests that the BFB cycle may be responsible for regions of focal amplifications. Such aberrant areas, which are found to over-express important oncogenes, may contribute to tumorigenesis and/or tumor progression in OS.
BREAKAGE-FUSION-BRIDGE • Fragile sites set amplicon boundaries • Inverted duplications • Amplified gene forms the ‘rungs’ of a • ladder in the marker chromosome
In MG63 BFB took place after rearrangements between chromosomes 6, 8 and 9
Evidence of BFB events in OS Inverted duplications associated with BFB
ANAPHASE BRIDGE CONFIGURATIONS amplification of alpha-satellite sequences (FISH probes)
Dicentrics in OS cell lines detected using pancentromeric PNA probe
SMRT array (Vancouver tiling set)MG-63 • Resolution: 79kb • can map chromosome arm breakpoints to a single BAC locus • allows genome-wide mapping of precise microamplification/ deletions containing oncogenes, tumor-suppressor genes and new genes that may be associated with multiple tumor type Resolution provided by clones in SMRT array
Tiling array CGH mapping of deletions and amplifications in OS MG63 cell line
Location of fragile sites
Somatic chromosomal mechanisms generating genetic diversity in tumors • Segregation anomalies • Cell cycle checkpoint defects • Ploidy alterations • DNA repair defects • Translocation frequency • Telomere crisis • Genomic architecture - fragile sites, microhomologies • Epigenetic alterations