Download
1 / 45
450 likes | 580 Vues
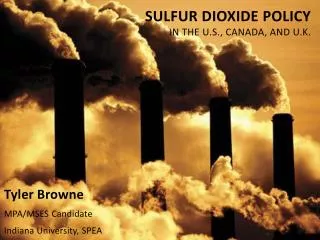
Sulfur Dioxide Policy in the U.S., Canada, and U.K. Tyler Browne MPA/MSES Candidate Indiana University, SPEA. Prologue. Purpose This comparative analysis aims to both identify and explain variation in sulfur dioxide policy instrument choice between nations

E N D
Sulfur Dioxide Policyin the U.S., Canada, and U.K. Tyler Browne MPA/MSES Candidate Indiana University, SPEA
Prologue • Purpose • This comparative analysis aims to both identify and explain variation in sulfur dioxide policy instrument choice between nations • Keep Dr. Richards’ framework in mind, especially the evaluation criterion “constrained cost-minimization formulation” Minimize ( PC + IC + TX ) where PC = production costs, IC = implementation costs, TX = public finance costs s.t. constraints: Pollution abatement requirement (efficacy), Legal constraints, Politics
Prologue • Findings • UNITED STATES • Layering of policy throughout recent history • 1963 Clean Air Act (CAA) • Relevant amendments in 1967, 1970, 1977, and 1990 • Current state of the law • Under the auspices of Title IV of the 1990 CAA Amendments, the US EPA administers an SO2 emissions cap-and-trade scheme with various nuances like permit auctioning, netting, bubbling, and banking
Prologue • Findings, continued • CANADA, EH? • Explicit difference between national and provincial government responsibility • National government • International treaties, setting the “tone” at home • Provincial governments (Ontario case study) • Emissions reduction credit trading scheme; some C&C
Prologue • Findings, continued • UNITED KINGDOM (YOU ARE HERE) • These blokes are subject to EU supranational directives, regulations, and communications • National government • Integrated and enforceable permitting system that includes SO2 emissions considerations in permitting decisions • Administration of Local Air Quality Management (LAQM) system and the so-called Beacon Scheme • Local governments • Implementation of Local Air Quality Management (LAQM) system
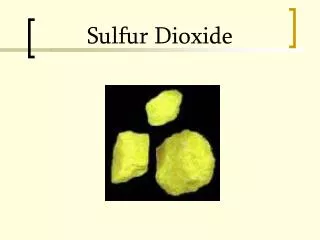
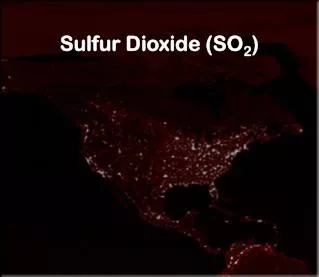
Introduction (to the so2 problem) • Basic science of sulfur dioxide • Atmospheric chemistry • “Once SO2 is released into the atmosphere, it may be converted to other compounds and/or removed from the atmosphere by various mechanisms. … SO2 is therefore removed from the atmosphere either unchanged or in the form of sulphuric acid and sulphates.” (WBK & Associates for Alberta Environment, 2003) • Fate • Oxidation (leads to various SOx, including sulfuric acid – H2SO4 – and sulfurous acid – H2SO3) • I’m no chemist, but these aren’t good
Introduction(to the so2 problem) • Fate, continued • Wet deposition – both as condensate within clouds and falling precipitation (this gives us what we know as ACID RAIN) • Dry deposition – direct deposition of gaseous and particulate species of sulfur dioxide on land or water surfaces • Dry deposition is more likely to be a local problem, whereas wet deposition is more likely to be a regional issue • Residency • Various estimates, but general range is anywhere from 1 to 10 days
Introduction(to the so2 problem) • Sources of sulfur dioxide as an air pollutant • General – sulfur dioxide is the result of the combustion (burning) of sulfur • S8 + 8 O2 → 8 SO2 • Natural – volcanic eruptions, wildfires • These are intermittent events that have the potential to release very large quantities of sulfur dioxide into the ambient air • Anthropogenic – Mainly fossil fuel combustion at power plants (73%) and other industrial processes (20%) (US EPA, 2011)
Introduction(to the so2 problem) • Impacts • Human health • An apple a day will NOT keep the acid rain away • But this doesn’t matter in terms of human health, only the particulate matter responsible for acid rain does • “Acid rain looks, feels, and tastes just like clean rain. The harm to people from acid rain is not direct. Walking in acid rain, or even swimming in an acid lake, is no more dangerous than walking or swimming in clean water. However, the pollutants that cause acid rain—sulfur dioxide (SO2) and nitrogen oxides (NOx)—do damage human health. These gases interact in the atmosphere to form fine sulfate and nitrate particles that can be transported long distances by winds and inhaled deep into people's lungs.” (US EPA, 2009)
Introduction(to the so2 problem) • Human health, continued • Short term exposure (5 min. to 24 hrs.) – adverse respiratory effects…beware asthmatics • Long term exposure – can cause or worsen various types of respiratory disease like emphysema and bronchitis • Monetizing the benefits of the US program via avoided health care costs • $50 Billion annually (US EPA, 2009) • Environment • Acidification of lakes and streams • This clearly isn’t good for either humans (who may rely on certain water sources) or animals (especially aquatic species that are sensitive to low pH levels)
Introduction(to the so2 problem) • Soil • Can reduce soil’s ability to provide plants and trees with vital nutrients • Can also release additional toxic substances like aluminum when exposed to acid rain • This all depends on the soil’s “buffering capacity” • Trees • Directly from dry deposition at high altitudes • Indirectly through effects on soil • Human environment (the stuff we make) • Accelerates decay of various building materials and paints • Threat to cultural heritage; economic costs • Decreased visibility (50 – 70% of visibility reduction in eastern U.S.) (US EPA, 2007)
Chapter 1:reduction methods • Mitigate • Simply avoid using organic compounds that contain sulfur, especially in electricity generation and major industrial processes • Reduce (but do NOT reuse and recycle) • Use organic compounds that contain lower amounts of sulfur • Ex: low sulfur coal • Reduce production processes that use organic compounds containing sulfur dioxide
Chapter 1:reduction methods • Technological reduction • Flue gas desulfurization (FGD) or “scrubbing” • Wet Scrubbing • Does not involve a soapy lather • “…wet scrubbers in which SO2 removal is accomplished by recirculating an aqueous slurry of lime or limestone in an absorber vessel to effect intimate contact with the flue gas.” (Paul Nolan, 2000) • Efficacy: nearly 100% removal, over 90% by-product is manageable solid • Dry Scrubbing • Absurdly difficult to explain • Efficacy: not as effective, used mainly as a retrofitting technology
Chapter 2:The U.S. Case (‘Merica) • In the beginning… • …there was the 1963 Clean Air Act (CAA) (listed as 42 U.S.C. § 7401) • Authorized Secretary of Health, Education, and Welfare (HEW) to establish non-mandatory air quality criteria and to intervene in pollution problems of individual states if health and welfare concerns • “Abatement was essentially dependent on the results of conference proceedings involving Federal, State, and local officials and representatives of various pollution sources” (DOE Office of HSS, 2001) • Authorized research into techniques for monitoring and control of various pollution sources, including sulfur dioxide
Chapter 2:The U.S. Case (‘Merica) • 1967 CAA Amendments (DOE Office of HSS, 2001) • Congress’ first attempt at comprehensive legislation; 4 prescriptions • Establishment of Air Quality Control Regions (AQCRs) • Issuance of “air quality criterion” and “control techniques” from HEW to states • Ambient air standards set by states for AQCRs • Development of state plans for implementation of air standards • Somewhat ineffective since Congress only made “prescriptions” • Only 21 states developed plans for submittal to HEW
Chapter 2:The U.S. Case (‘Merica) • 1970 CAA Amendments (US EPA, 2010 and 2011) • Establishment of framework upon which today’s laws are built; 4 regulatory programs • National Ambient Air Quality Standards (NAAQS) – enforceable by US EPA • Primary (human health) and secondary (public welfare, environment) • State Implementation Plans (SIPs) • State issued, US EPA-approved; federal provision IF necessary (FIPs) • New Source Performance Standards (NSPS) • Ex ante, permit-based technology standards for new stationary sources • Best Available Control Technology (BACT) • National Emissions Standards for Hazardous Air Pollutants (NESHAP) • Not directly relevant to SO2; Hazardous Air Pollutants group, this is you
Chapter 2:The U.S. Case (‘Merica) • 1977 CAA Amendments (DOE Office of HSS, 2001) • New Source Review (NSR) – amendment to NSPS • Ex ante, permit-based BACT now for modified existing sources also • Foundations of the future emissions trading program • Offsetting policy • “A system of emission offsets whereby new emitting sources could pay existing sources to reduce their emissions sufficiently to offset any increase in emissions” (Burtraw, et. al, 2005) • Bubbling policy • EPA emissions permits affect an entity’s multiple smokestacks and facilities as if they were encompassed by a “bubble,” thus rendering them one cohesive unit
Chapter 2:The U.S. Case (‘Merica) • Foundations of the future emissions trading program, continued • Netting policy • Allows modifications to avoid technology standards of NSR if plant emission increases are negligible or non-existent • Affords some freedom for firms from BACT standard • Banking policy • Emission reductions can be “banked” for later use; no requirement to benefit immediately from reductions
Chapter 2:The U.S. Case (‘Merica) • Title IV of the 1990 CAA Amendments (US EPA, 2009) • Political compromise between emitters and environmentalists • Cap satisfies environmental requirement, emission allowance trading satisfies economic requirement of efficient allocation of costs • Goal: to reduce SO2 emissions to 10 million tons below 1980 levels (from about 20 million to about 10 million tons, actually) • Phase I (1995 – 1999) • 263 stationary sources, mostly in East and Midwest, affected • Given time to prepare, actual allowance prices much lower than expected • Open to joiners (increased cost efficiency); eventually 445 affected units • Eventually (again to increase cost efficiency) whole nation involved
Chapter 2:The U.S. Case (‘Merica) • Title IV of the 1990 CAA Amendments, continued • Phase II (2000-2010) • Introduction of many new, often smaller, sources (up to 2000); threshold set at 25 MW; all new sources subject to Phase II • Cap remained the same at around 10 million tons but is allocated among many more sources; this essentially tightened the restrictions on average for individual firms (subject to allowance trading, of course) • Allowance Trading • Fixed number of allowances each year (1 allowance = 1 ton SO2) • Cap, as of 2010, is now set at 8.95 million tons SO2 (8.95 million allowances) • Allowances left over after accounting for emission can be traded, banked, or sold to the EPA for future auctioning
Chapter 2:The U.S. Case (‘Merica) • Title IV of the 1990 CAA Amendments, continued • Allocating Allowances • Phase I • Grandfathered – allocation based on a formula that takes into account past emissions (1985 – 1987) • Phase II • Mixture between Auctioned and Grandfathered permits • Grandfathered – formula altered to reduce number of allowances allocated • Auctioned – remaining allowances (~10 million allowances less grandfathered permits in a given year; now, though, cap is at 8.95 million) • Both a spot market and 7-year advance market • Only source of allowances for sources that came online after 1996
Chapter 2:The U.S. Case (‘Merica) • Title IV of the 1990 CAA Amendments, continued • Enforcement (Respect my authoritay) • March 1st deadline for reporting emissions/allowances balance • If allowances > emissions, positive balance is banked • If allowances < emissions, pay penalty AND lose equivalent of difference in following year’s allocation process • Penalty has inter-temporal flexibility…as of 2009, penalty was $2000 per excess ton of SO2 emissions • OUCH – this easily outweighs the cost of a typical allowance • Very effective enforcement has led to over 99% compliance rate • Overall, cap-and-trade system has reduced SO2 emissions by 70% since 1980
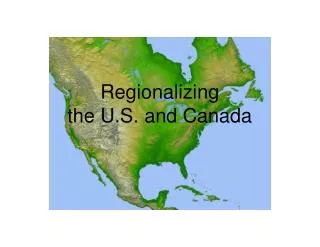
Chapter 3:The Canadian Case (Eh?!) • 1991 Canada-US Air Quality Agreement • Created under the auspices of the International Joint Commission (IJC) • IJC – Canada and US working together on various border issues, esp. water • Created as part of the 1909 Boundary Waters Treaty • U.S. Commitment • Forms the basis for the 2010 reduction in overall allowances to 8.95 million • Continuous monitoring required • Canadian Commitment • 3.2 million tons per year cap by 2000 (same as UNECE LRTAP) • 2.3 million tons per year cap in eastern provinces by 1994 (less stringent than UNECE LRTAP’s 1994 Protocol , which strengthened this commitment) • “Method of comparable effectiveness of continuous monitoring”…whatever that means
Chapter 3:The Canadian Case (Eh?!) • 1979 UNECE LRTAP and Protocols • “UN Economic Commission for Europe Convention on Long-Range TransboundaryAir Pollution” (Thank God for acronyms) • Relevant protocols (signed AND ratified by Canada) • 1985 Protocol on the Reduction of Sulphur Emissions or their Transboundary Fluxes by at least 30 Percent (25 parties) • Entered into force 1987 • Canadian burden: cap national SO2 emissions at 3.2 million tons per year by 1993 • 1994 Protocol on Further Reduction of Sulphur Emissions (29 parties) • Entered into force 1998 • Canadian burden: cap southeastern regional emissions at 1.75 tons per year by 2000
Chapter 3:The Canadian Case (Eh?!) • Separating National and Provincial Responsibility • 1985 Acid Rain Agreement • Goal: to limit deposition of sulphates in precipitation to no more than 20 kg per hectare per year • National government commitment • “The federal government was responsible for reducing the flow of acid pollutants into Canada because half of the acid deposition in eastern Canada came from American sources.” (Environment Canada, 2010) • Provincial commitment • “The provinces agreed to cap SO2 emissions at 2.3 million tonnes to be achieved throughout eastern Canada by 1994 based upon calculations from a science assessment that determined how many tonnes of SO2 could be emitted in Canada in order to achieve the 20 kg/ha/yr “target load”, provided commensurate SO2 reductions occurred in the U.S.” (ibid)
Chapter 3:The Canadian Case (Eh?!) • Separating National and Provincial Responsibility • So, in plain English what the heck does this mean? • National government is essentially responsible for establishing international commitments and conducting international treaty negotiations • Provincial governments, especially the eastern provinces, are responsible for actually selecting and implementing whatever policy instruments are necessary for reaching the 2.3 million ton cap • The national government, as we shall see, assists in this endeavor by creating an atmosphere of collaboration and information-sharing between levels of government, industry, and citizens • How Canadian of them, eh?
Chapter 3:The Canadian Case (Eh?!) • Domestic Action by the National Government • Via relevant agency – Environment Canada • “Sulphur Oxides” listed in Environment Canada’s group of “Criteria Air Contaminants” or CACs • CACs are subject to inclusion in annual summary statement by the National Pollutant Release Inventory (NPRI) • National government, through the Environment Agency’s consensus building strategy of forging relationships with individual emitters, is able to both collect and disseminate emissions data • Relevant legislation administered by Environment Canada – 1999 Canadian Environmental Protection Act (CEPA 1999)
Chapter 3:The Canadian Case (Eh?!) • CEPA 1999 • Collaboration and consensus building • Establishment of National Advisory Committee • To advise the Environment Agency Minister on “cooperative, coordinated intergovernmental approach for the management of toxic substances” • Representatives from various ministries, from each province, and from up to six aboriginal governments • Weak enforcement powers afforded to the Minister and the Environment Agency’s enforcement officers • Proposed “Environmental Enforcement Bill” to hopefully address this issue
Chapter 3:The Canadian Case (Eh?!) • CEPA 1999 • Minister given SIGNIFICANT power to formulate regulations, but up until now only sulfur restrictions on gasoline and diesel fuel have been made • So CEPA 1999 creates a framework in which regulation could be formulated by the Minister with consultation from the National Advisory Committee, but doesn’t actually establish any actual regulation • The current lack of regulation is a clear sign that the national government, while reserving the right to establish national-level regulation, chooses to defer such power to the provincial governments
Chapter 3:The Canadian Case (Eh?!) • Provincial government action (Ontario case study) • Environmental action, including reporting, monitoring, creating and managing regulations, etc. is managed by the Environmental Commissioner of Ontario (ECO) of the Ontario Ministry of the Environment (MOE). • That sounds ridiculous when said out loud • ECO sometimes administers what are called “control orders” to specific sources of emissions • Direct command and control • Ontario Regulation 397/01 (2002) • Created under the auspices of the Ontario Environmental Protection Act • Establishes caps and emissions trading rules for both SOx and Nox
Chapter 3:The Canadian Case (Eh?!) • Ontario case study, continued • SOx and NOx emissions cap and trade program (Regulation 397/01) • “The regulation sets limits for airborne emissions of nitrogen oxides (NOx) and sulphur dioxide (SO2) from Ontario's larger electricity generators and defines the rules (the Code) for the creation and trading of the associated emissions reduction credits (ERCs) and allowances.” (MOE, 2010) • Scope • Only select electricity generators in 2002 • Expanded to include all electricity generators larger than 25 MW by 2006
Chapter 3:The Canadian Case (Eh?!) • Ontario case study, continued • Establishing emissions caps and allocating allowances • Provincial, aggregate cap is first step • 2002-2006: 157.5 kilotonnes of SO2 aggregate per year • 2007-2008: 131 kilotonnes of SO2 aggregate per year • Grandfathered allowance allocation within this provincial cap • Based on percentage of overall provincial power production from previous year • The so-called “Set Aside” • 4 kilotonnes per year of SO2 is set aside from within provincial cap • This set aside is “…accessible to approved new conservation and renewable energy projects which displace electricity produced from coal or oil-fired plants.” (MOE, 2010)
Chapter 3:The Canadian Case (Eh?!) • Ontario case study, continued • Monitoring • All affected installations are required to install continuous emissions monitors • Or alternative monitors that gain MOE approval • Credit creation (within AND without Ontario’s borders – spatial aspect of SO2) • Emissions Reduction Credits (ERCs) are eligible from 12 US states (NY, PA, NJ, DE, MD, WV, KY, OH, MI, IN, IL, and D.C.) as well as from within Ontario • ERCs can be accumulated within 7 years of a given project’s initiation; ERCs can only be claimed once from a given project • All ERC transactions are subject to MOE approval • ERCs can only account for up to 33% of an affected source’s allowances • Only 90% of an approved ERC is eligible for allowance vs. emissions accounting
Chapter 3:The Canadian Case (Eh?!) • Ontario case study, continued • Banking • Same concept as the US case; banking of ERCs and allowances is permitted without limitation • Enforcement • ??? • Overall effectiveness of Canadian action • 54% reduction in SO2 emissions from 1990 to 2009
Chapter 4:The U.K. Case (you are here) • 1979 UNECE LRTAP and Protocols • Same acronym as before…did you forget it? Me too. • Relevant protocols (signed AND ratified by U.K.) • 1994 Protocol on Further Reduction of Sulphur Emissions • Entered into force 1998 • 1999 Gothenburg Protocol to Abate Acidification, Eutrophication and Ground-level Ozone • Entered into force 2005 • UK commitment: cap SO2 emissions at 625,000 tons per year, starting in 2010
Chapter 4:The U.K. Case (you are here) • European Union (EU) Supranational Action • The United Kingdom is a member state of the European Union and is therefore subject to the European Council’s directives, decisions, etc. • This relationship plays a large role in the United Kingdom’s policy decisions • Air Quality Framework Directive (Council Directive 96/62/EC) • “It describes the basic principles as to how air quality should be assessed and managed in the Member States.” (European Commission, 2011) • “It lists the pollutants [including SO2] for which air quality standards and objectives will be developed and specified in legislation.” (ibid)
Chapter 4:The U.K. Case (you are here) • EU Supranational Action, continued • First Daughter Directive (Council Directive 1999/30/EC) • “The directive describes the numerical limits and thresholds required to assess and manage air quality for the pollutants mentioned [sulphur dioxide, nitrogen dioxide and oxides of nitrogen, particulate matter, and lead in ambient air].” (European Commission, 2011) • Other directives, known respectively as the second, third, and fourth daughter directives describe limits for other substances like ozone and cadmium • Decision on Exchange of Information (Council Decision 97/101/EC) • Establishes “a reciprocal exchange of information and data from networks and individual stations measuring ambient air pollution within the Member States… • “…describes the procedures for the dissemination of air quality monitoring information by the Member States to the Commission and to the public.”(ibid)
Chapter 4:The U.K. Case (you are here) • EU Supranational Action, continued • Annual Reports for Member States (Commission Decision 2004/461/EC) • “This decision specifies the format and content of Member States' AnnualReport on ambient air quality in their territories.” (European Commission, 2011) • NEWEST Directive (Council Directive 2008/50/EC) • Four elements: • Consolidation of previous suite of Council Directives into one • New objectives for fine particles • Possibility for taking natural sources of pollution into account for compliance • Problematic? • Time extensions for member state compliance, but NOT for SO2
Chapter 4:The U.K. Case (you are here) • EU Supranational Action, continued • Integrated Pollution Control (IPPC) – (Directive 2008/1/EC) • Covers some 52,000 installations throughout Europe, 4300 of which are in UK • Permitting policy instrument; “polluter pays” ideology • “This Directive (“the IPPC Directive”) requires industrial and agricultural activities with a high pollution potential to have a permit. This permit can only be issued if certain environmental conditions are met, so that the companies themselves bear responsibility for preventing and reducing any pollution they may cause.” (Europa, 2010) • Eligibility – vague requirements leaves Member States with discretion • Still, some specific requirements outlined by Council (prescriptive) • Scope • New or existing facilities with “high pollution potential” • Energy industries, production and processing of metals, mineral industry, chemical industry, waste management, livestock farming, etc.
Chapter 4:The U.K. Case (you are here) • EU Supranational Action, continued • IPPC Directive administrative and monitoring measures • Permit challenges – Once a permitting decision has been issued by the relevant Member State environment agency, “The Member States must, in accordance with their relevant national legislation, make provision for interested parties to challenge this decision in the courts.” (Europa, 2010) • Monitoring - “The Member States are responsible for inspecting industrial installations and ensuring they comply with the Directive.” (ibid) • Best Available Techniques (BATs) – regular exchange between industry, Member States, and European Commission • Reporting – Member States required to report regularly to the Commission via the so-called “European Pollutant Release and Transfer Register” (PRTR)
Chapter 4:The U.K. Case (you are here) • EU Supranational Action, continued • Last but not least: EU administered Emissions Ceilings (Directive 2001/81/EC) • UK is subject to an annual ceiling, starting in 2010, of 585 thousand tonnes of SO2 • Compare this to the UK’s commitment to a cap of 625 thousand tons in the 1999 Gothenburg Protocol to the UNECE LRTAP • So, given these prescriptions and emissions caps from the European Union’s European Council, the UK is responsible for developing its own domestic infrastructure for reaching and maintaining compliance
Chapter 4:The U.K. Case (you are here) • UK Domestic Action • UK’s Industrial Pollution Control Regime • Domestic legislation – Environmental Permitting (England and Wales) Regulations 2010 (Statutory Instruments 2010 No. 675) • “The UK's industrial pollution control regime implements a range of directives, such as IPPC…Emission limits and other control parameters are specified in enforceable permits.” (DEFRA, 2007) • UK’s Environment Agency is primary regulator and is responsible for administering pollution control permits to some 4300 affected installations • This represents 90% of emitters affected by EU IPPC Directive; remaining facilities are covered by localities, including all those not affected by IPPC • Enforcement – notices, permit suspensions, penalties (usually monetary, up to £50,000 , but could potentially be criminal)
Chapter 4:The U.K. Case (you are here) • UK Domestic Action, continued • Local Air Quality Management system (LAQM) • “The Environment Act 1995 and the Environment (Northern Ireland) Order 2002 introduced the system of local air quality management (LAQM).” (Sec. of State for EFRA, 2007) • Local authorities are required periodically to review and assess the current and predicted future quality of air in their areas against those objectives in the Strategy which have been prescribed in UK Regulations • Where a local air quality fails to meet the required standard, that authority must declare an air quality management area (AQMA) and then draw up an action plan (possible parallel with SIPs in the US case) • National support for local action • Promoting BATs via the so-called “Beacon Scheme”
Epilogue:Class Discussion • It is now time to pay attention • How can we evaluate these three cases? “constrained cost-minimization formulation” Minimize ( PC + IC + TX ) where PC = production costs, IC = implementation costs, TX = public finance costs s.t. constraints: Pollution abatement requirement (efficacy), Legal constraints, Politics
“Mom, my salad tastes like sulfuric acid” Seriously, though, THANK YOU for listening!