Download
1 / 32
320 likes | 452 Vues
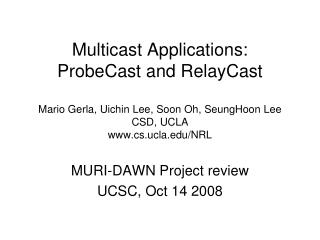
Multicast Applications: ProbeCast and RelayCast Mario Gerla, Uichin Lee, Soon Oh, SeungHoon Lee CSD, UCLA www.cs.ucla.edu/NRL. MURI-DAWN Project review UCSC, Oct 14 2008. Progress in 2007-2008. Data dissemination (DTN scenarios) RelayCast : a scalable DTN multicast protocol (ICNP 2008)

E N D
Multicast Applications:ProbeCast and RelayCastMario Gerla, Uichin Lee, Soon Oh, SeungHoon LeeCSD, UCLAwww.cs.ucla.edu/NRL MURI-DAWN Project review UCSC, Oct 14 2008
Progress in 2007-2008 • Data dissemination (DTN scenarios) • RelayCast: a scalable DTN multicast protocol (ICNP 2008) • Impact of correlated motion on unicast DTN routing (work in progress) • 2 phase inter-contact time distribution: power law head with exponential tail • Capacity/delay of DTN unicast routing • ProbeCast: multicast admission control (Q2SWINET 2008) • Resource probing + pruning, neighborhood proportional drop (NPROD) for fair share of a channel • Network coding configuration/implementation • Communication, disk I/O, encoding overhead analysis (using measurement based models) • MobSim: an interactive vehicular motion simulator
R1 Disrupted node Disrupted node R4 R1 R1 F R4 R1 R2 S mobility R2 R2 mobility S R3 R3 F S S Tree Mesh Ferry/mule Dissemination DTN Multicast Routing • Provides reliable data dissemination (e.g., situation awareness data) even in disrupted environments • DTN multicast routing strategies • Tree, mesh, ferry/mule, epidemic dissemination • Use mobility-assist routing to deal with disruptions
Scaling Properties of DTN Multicast • Questions: • Achievable DTN multicast throughput; average delay • Compare with existing capacity/delay bounds of ad hoc wireless networks (Gupta&Kumar) • Trade-offs: • Infinite buffers: throughput/delay trade-offs • Finite buffers: throughput/buffer tradeoffs • Modeling approach: • Inter-contact time models • Queueing models (for throughput/delay/buffer analysis)
Source Relay Destination Review: 2 Hop Relay • 2-hop relay: 1. Source sends a packet to a relay node 2. Relay node delivers a packet to the corresponding receiver 2-hop Relay by Grossglauser and Tse
D2 D3 D1 Source Relay Destinations RelayCast: DTN Multicast Routing • 2-hop relay based multicast: 1. Source sends a packet to a relay node 2. Relay node delivers the packet to ALL multicast receivers RelayCast: 2-hop relay based multicast
Two-Hop Relay Review Intuition: average throughput is determined by aggregate encounter rate (src relay and relay destinations) How often does a destination node encounter any of the relay nodes? Answer: n*λ Two-hop relay per node throughput : Θ(nλ) Aggregate meeting rate at a destination: nλ Grossglauser and Tse’s results: Θ(nλ)=Θ(1) Recall: λ = 1/n (i.e., speed 1/√n, radio range 1/√n)
RelayCast: Throughput Analysis • Multicast traffic pattern: • ns sources, each of which is associated with nd random destinations • Different sources may choose the same node as one of their receivers • Fraction of sources per receiver : nx =nsnd/n • A source chooses a node as dest with prob. nd/n • Fraction of aggregate packets per source = 1/nx • RelayCast throughput: Θ(nλ/nx)=Θ(n2λ/nsnd) • i.e. = (#of nodes) x rate x frct of packets per source
3λ 2λ λ 3 2 1 0 RelayCast: Delay Analysis • One relay node delivers packets to all receivers • RelayCast delay: Θ(log nd /λ) • Unlike conventional multicast, delay is proportional to the number of receivers R2 R1 X2 R3 X1 Markov Chain for delivery status: Average delay = average time to absorb = 1/3λ + 1/2λ+1/λ (memoryless!) R X3 relaynode D=max(X1, X2, X3)
Assumptions; n fixed; r = √logn/n G&K; r=√1/n for 2-hop relay Throughput scaling comparison with ns= Θ(n) nd: # receivers, n: total # nodes RelayCast is better than conventional multi-hop multicast (r= √logn/n) Grossglauser & Tse, INFOCOM’01Delay Tolerant Apps RelayCast: Delay Tolerant Apps Gupta & Kumar, TOIT’00 Shakkottai et al., Mobihoc’07Li et al., Mobicom’07 Tavli, IEEE Com. Letter’06Keshavarz-Haddad et al., Mobicom’06 Comparison with Previous Results Per node throughput with ns= Θ(n) Number of m-cast receivers per source
Simulation Results • Comparison with Conventional Multicast Protocol • Connected topology • RelayCast is scalable; ODMRP’s throughput decreases significantly, as # sources increases * QualNet v3.9.5 * Mobility: random waypoint (speed = 20, 30m/s) * Network area size: 1000m*1000m * 100 Nodes, 250m TX range 5 destinations
Two-phase Inter-contact Time • Two-phase distribution: power-law head and exponential tail Chaintreau06 Karagiannis MobiCom 07 Infocom 06 Levy walk: Rhee Infocom 08 • Association times with AP (UCSD) or cell tower (MIT cell) • Direct contact traces: Infocom, cambridge (imotes), MIT-bt
Two-phase Inter-contact Time • Why two-phase distribution? • One possible cause: flight distance of each random trip [Cai08] • The shorter the flight distance, the higher the correlation heavier power tail • Examples of correlations: • Manhattan sightseers: In Time Square, sightseers tend to bump into each other; and then depart for other sights • Levy flight of human walks [Rhee08]: short flights + occasional long flights • Vehicular mobility: Constrained by road traffic (+traffic jam) • High correlation among vehicles in close proximity • After leaving locality, vehicles meet like “ships in the night” • Power-law head while in the local contention area, vs. exponential tail for future encounters *Cai08: Han Cai and Do Young Eun, Toward Stochastic Anatomy of Inter-meeting Time Distribution under General Mobility Models, MobiHoc’08*Rhee08: Injong Rhee, Minsu Shin, Seongik Hong, Kyunghan Lee and Song Chong, On the Levy-walk Nature of Human Mobility, INFOCOM’08
Two-hop Relay Unicast under Correlated Motion Patterns • Impact of correlated motion patterns on throughput/delay performance? • Under the average flight distance of Ω(r); i.e., minimum travel distance ~ one’s radio range • Increase correlation by decreasing flight distance • Preliminary analytic results : • Throughput: Independent of node speed and degree of correlation (ie, flight distance) • Average delay is within [1/λ, logn/λ]; i.e., random direction (to wall) and random walk respectively • Delay monotonically increases with the degree of correlation • Buffer requirement also increases • Using Little’s results: [Θ(nr/v), Θ(nrlogn/v)] • Simulation results: • Correlation increases burstiness of traffic in and out of relays
Simulation: Throughput • Degree of correlation via average flight distance L • 5000m*5000m area • L=R=250m high correlation power law head + exponential tail • L=1000m low correlation almost exponential • Throughput is independent of the degree of correlations L=250m Exp L=1000m L=250m log-linear plot CCDF of inter-contact time (20m/s)(Log-log plot) Average throughput per node as a function of # relay nodes
Simulation: Buffer Utilization • Burstiness increases with the degree of correlation Cumulative distribution of the number of consecutiveencounters Buffer utilization over time (speed=30m/s)
Summary: DTN Routing under Correlated Motion Patterns • Per-node throughput is not affected by the degree of correlation • However, correlation causes increases in: • Variance in the inter-contact time • Average delay • Buffer requirements • Burstiness of inbound/outbound
ProbeCastS. Oh, G. Marfia, M. Gerla, Q2SWINET 2008 The Problem: • Resource reservation/allocation schemes are ineffective in inelastic multicast in ad hoc nets • Bookkeeping is very cumbersome (as # of destinations increases); • Also, mobility requires continuous re-adjustments • Without QoS support, quality will collapse Flow 1 has 9 receivers with 200Kbps and flow 2 has 3 receivers with 40Kbps • Goal: • Achieving reliable QoS support in inelastic multicast flows (e.g., video and audio stream)
ProbeCast: key insights • Insight #1: Resource Probing • No a priori resource allocation • Rather “probe” for resources • Insight #2: Pruning via Back-pressure • Back-pressure (“prune”) toward the source when resource is unavailable • Re-route or reject the inelastic flow • Insight #3: Neighborhood Proportional Drop (NPROD) • Local rate balancing using proportional dropping • Enforces fair channel sharing “fair back-pressure” • Main Outcome: • Inelastic flows to acquire resources in fair manner without reservation, yet preserving reliable QoS
ProbeCast Approach • Assumptions: • End-to-End FEC – e.g. erasure coding – always ON • Each flow has packet drop threshold • Probing • Each node measures resource overload – e.g. packet drop rate • Broadcast to one hop neighbors own drop rate via piggybacking on packets • Proportional Drop (N-PROD) • Overhearing neighbors’ drop rates • Enforcing equal drop rates among flows competing in the same contention domain – packet drop • Nodes in the same contention domain sharing channel fairly
ProbeCast Approach (Cont.) • Pruning • Drop-Threshold (DT) for flows • traffic class and flow age dependent • Piggybacking DT on the packet Forwarders know Drop Threshold of flows • Typically, incoming flow has lower threshold than incumbent • When drop rate is > threshold, a flow is back-pressured no explicit control packets to source • Source action: • re-route if there is alternative route; • otherwise reject the flow
Probe/Prune + N-PROD at Work (A) 3 flows in the same contention domain. Lower graphs shows packet delivery ratios, presented by percentages. (B) Flow 3 starts transmitting and other flows’ rates decrease (N-PROD). (C) Since flow 3 drop rate exceeds the threshold, backpressure starts.
Simulation - Fairness • Qualnet Simulation: 50 nodes uniformly distributed 1000 mby 1000 m field • Flow 1 has 9 receivers with 200Kbps and Flow 2 has 3 receivers with 40Kbps • N-PROD eliminates capture problem increasing FAIRNESS
generation X1 X2 X3 e3 e1 e2 + [e1,e2,e3] e1X1+e2X2+e3X3 NC Implementation GuidelinesS. Lee, U. Lee, K-W. Lee, M. Gerla SECON 2008 • Goal: show that NC can be implemented in military scenarios • Develop configuration guidelines based on measured data • We start with Network Coding processing O/H analysis • Linearly proportional to the number of packets in a generation (= generation size) • Generation size must be carefully chosen: max node encoding rate > (available) wireless bandwidth
N2 Nokia N800: TI OMAP 2420 (330Mhz) + 802.11b N1 Orinoco8471 WD IBM Thinkpad R52 N3 Scenario: k contendersin domain (k=1/2/3) NC Throughput Measurement • Validation through measurements using portable devices
G10 = 10 packets in generation • N/A: No network coding Number of contenders in a domain NC Throughput Measurement • large generation => high CPU O/H => low pkt tx • As the number of contenders increases, pkt tx rate must decrease can support a larger generation size • For small unit operations, optimal Gen Size < 50 (from experiments) • Well suited for network coding based streaming (i.e., CodeCast)
MobSim: An Interactive Simulator for Urban MobilityC. Li, M. Bansal, U. Lee, K.-W. Lee, M. GerlaACITA Demo Session • Limitations of current simulators • Non-realistic urban mobility models • Non-interactive simulations • MobSim design goals: • Programmable mobility model • Interactive simulation environment • Built-in appl modules (eg dissemination)
Applications Mobility Generator: Tiger map + IDM Real-time Visualization Module Data DisseminationProcessing Module InteractiveSimulation UI MobSim MobSim Architecture • Mobility Generator: • Tiger map of target urban area • Underlying vehicle motion pattern (eg, commuting, shopping, etc) • Application: • E.g., Data Dissemination Processing Module • Target selection; Agent vehicles, etc • Real-time Visualization Module • Interactive Simulation UI
End Start Road-constrained Motion Model • For each car, pick random start/end points and speed • Construct the shortest path • Travel at variable speed on each segment
Harvest Move to Last Encounter Point Agent Tracks Target using Last Encounter Routing • Agent moves in direction hinted by cars that last encountered the target • While moving, agent continuously looks for fresher encounter information
MobSim Screenshot MobSim: Simulation Results • Average search time with varying number of agents and number of nodes
Future Work • Impact of different vehicle and agent motion patterns • Impact of density (e.g., intermittent connectivity) • Bio-inspired multiple agent collaboration algorithm (i.e., Lévy jump based searching + datataxis) • Investigate realistic urban warfare scenario (e.g., hints about enemy movements)