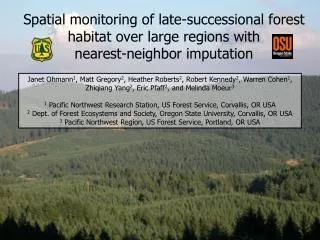
Spatial Monitoring of Late-Successional Forest Habitat with Nearest-Neighbor Imputation
190 likes | 297 Vues
Utilizing advanced technologies to monitor and assess changes in late-successional forest habitats over large regions through nearest-neighbor imputation and Landsat time series analysis. Preliminary results show net loss of LSOG forests with potential noise in the data. Improvement strategies and validation approaches are discussed.

Spatial Monitoring of Late-Successional Forest Habitat with Nearest-Neighbor Imputation
E N D
Presentation Transcript
Spatial monitoring of late-successional forest habitat over large regions with nearest-neighbor imputation Janet Ohmann1, Matt Gregory2, Heather Roberts2, Robert Kennedy2, Warren Cohen1, Zhiqiang Yang2, Eric Pfaff2, and Melinda Moeur3 1 Pacific Northwest Research Station, US Forest Service, Corvallis, OR USA 2 Dept. of Forest Ecosystems and Society, Oregon State University, Corvallis, OR USA 3 Pacific Northwest Region, US Forest Service, Portland, OR USA
Needs for regional vegetation information • Complexity and scope of current forest issues (sustainability, climate change, etc.) are pushing technology to provide information that is: • Consistent over large regions, detailed forest attributes, spatially explicit (mapped)... with trend information (monitoring) • Can we marry two current technologies to better meet needs? • Nearest-neighbor imputation (detailed attributes) • Change detection from Landsat time series (trends) • Approach: minimize sources of error in two model dates, map real change
Northwest Forest Plan of 1994 • Conservation plan for older forests and species on federal lands • Effectiveness Monitoring: • Develop maps for assessing change in older forest and habitat, 1996 to 2006 Provinces (23 mill. ha.) USA
Regional inventories: unbalanced in space and time • Choose one plot per location • Match to closest (96 or 06) imagery date • Develop single gradient model with all plots • Apply model to each imagery year • Imagery is only source of change (gradient model, plot sample, and other GIS layers held constant) Imagery years
Landsat Detection of Trends in Disturbance and Recovery (LandTrendr)* • Normalizes across time-series at pixel level • Change ‘trajectories’ describe sequences of disturbance, regrowth • Frequent time-steps • Detect gradual and subtle changes • ‘Temporally normalized’ imagery for multi-year GNN *Kennedy et al. (in press), Rem. Sens. Env.
Defining ‘late-successional and old growth’ (LSOG) forest • Simple definition for this analysis: • QMD > 50 cm • > 10% canopy cover • Compute from tree-level data, associate with GNN pixels • Ideally, ecological definition (index based on multiple components): • Large, old live trees • Large snags • Large down wood • Multi-layered canopy
Aggregate change in older forest (LSOG) at regional level • Slight net loss (33.2% to 32.5%) • 3% of 1996 LSOG lost, mostly to large wildfires, partially offset by regrowth in other areas • Over 10 years, net change signal is swamped by noise Based on LSOG % correct from cross-validation
Not LSOG LSOG gain LSOG loss LSOG Nonforest Spatial change in Klamath province, 1996-2006 • Change is dramatic in some landscapes (2002 Biscuit Fire) • Spatial change is quite noisy
Not LSOG LSOG gain LSOG loss LSOG Nonforest Spatial change at landscape level 2006 Landtrendr B-G-W 1996 Landtrendr B-G-W GNN change
Pixel-level noise in GNN models • GNN with k=1 is inherently noisy: sensitive to slight spectral shifts • Minor changes cause plots to cross definition threshold (QMD) • Problems magnified by model ‘subtraction’ (spatial predictors, plot sampling and location errors, model specification, etc.) • GNN cross-validation applies to 2-date ‘hybrid’ model, not spatial change All plots 1991-2008
How reliable is spatial change from two GNN models? • What is truth? No data available for validating spatial change. • Corroborates other estimates: • Plot-based estimates from FIA Annual inventory • Within 1% of previous 1996 estimate (different methods) • Slight net loss corroborated by remeasured plots • A different approach to validation is needed... FIA Annual plots 2001-2008 Oregon Western Cascades
TimeSync validation(Cohen et al. in press, RSE) • Expert interpretation of Landsat time series and ancillary data 1998 2005
Adapting TimeSync to validation of GNN change (1996-2006) Confusion matrices: Data recording in TimeSync:
Lessons learned: multi-temporal GNN for monitoring • Only feasible with “temporally normalized” imagery • Net change over large spatial extents is reasonable • More work to quantify our ability to map pixel-level change • 10 years is insufficient to reliably map ‘ingrowth’ of older forest, but loss from disturbance is feasible
Improvements coming soon... • Yearly matching of plots to imagery • Prior disturbance and growth (from LandTrendr) informs model Disturbance Magnitude (1996 to 2006) Imagery years
Normalized Landsat mosaics (Remote Sensing Applications Center, USFS) 1996 2006 1996 B-G-W 2006 B-G-W • GNN QMD “change” • (bias associated with aspect) 1996 GNN QMD 2006 GNN QMD