Download
1 / 53
530 likes | 671 Vues
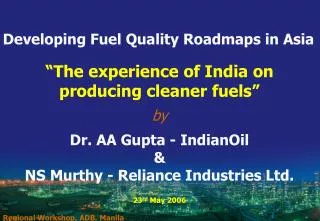
Developing Fuel Quality Roadmaps in Asia. “The experience of India on producing cleaner fuels” by Dr. AA Gupta - IndianOil & NS Murthy - Reliance Industries Ltd. 23 rd May 2006 Regional Workshop, ADB, Manila. Clean Fuels Initiatives - India. Glimpse of Oil Sector in India

E N D
Developing Fuel Quality Roadmaps in Asia “The experience of India on producing cleaner fuels” by Dr. AA Gupta - IndianOil & NS Murthy - Reliance Industries Ltd. 23rd May 2006 Regional Workshop, ADB, Manila
Clean Fuels Initiatives - India • Glimpse of Oil Sector in India • Indian Clean Air Programme • Clean Fuels – Experiences • Clean Fuels - Redefined • Road Ahead
Panipat Digboi NRL Mathura BRPL Guwahati Barauni RIL, JN Haldia Vadodara ONGC, Hz BPCL, BBY HPCL Vizag HPCL,BBY MRPL, ONGC CPCL, Chennai CPCL, CB KRL Operating Refineries in India 18 operating refineries & 6 more coming up.
Indian Refineries Of the refining capacity of 126MMTPA, IOC & RIL share nearly 60%.
Fuel logistics Scenario in India Surplus / (Deficit) – Y 2003/04 Diesel - 6.18 MMTPA. Gasoline - 2.98 MMTPA. LPG - (2.18) MMTPA Kerosene - Nil (after stopping import by parallel Mkt) ATF - 1.66 MMTPA Gasoline & Diesel remain surplus for next 10 years while LPG & Natural Gas continue to be deficit. Source: Petrofed Surplus Gasoline and Diesel push quality competitiveness.
Air Quality Standards in India • In Indian context CO pollution, Particulate (PM10 ,PM2.5 &PM0.1) and NOx (in select cities) are areas of concern. Internationally concerns are raised about ground level Ozone, Benzene & other air toxins such as 1,3 butadiene, aldehydes, alkenes, etc. Each nation devices & adopts a balanced approach for BAQ.
Vehicle Tech & retiring Product Quality Assurance Ambient air quality I & M practices Adulteration menace Enforce PUC Trans-border issues Traffic Mgt & Road Maint. Point emission & Construction activities Tail pipe devices Ambient air quality – Factors involved – an integrated approach pays rich benefits for the cost spent
NGO • Academia • Judiciary • Agriculture sector • such as sugar OEMs & Garages Transport sector Vehicle owners Oil Companies • IP: GOI-MOP&NG, • MOI,MOST, MOEF, • CPCB, MOCA, BIS, • ARAI, NEERI, IICT, etc. • State Govts & PUC • Implementing • Departments Stakeholders in Auto Oil Program & AAQ For the health of common man on the kerb-side Growing awareness in India for BAQ amongst key stakeholders
I CAP – Mission • Conduct a scientific ambient air quality study in metros involving source identification, emission factors generation and apportionment thru modeling. • Provide a cost benefit solution for BAQ considering issues like ‘in use vehicles’, I&M practices, traffic mgt, product quality assurance, developments in Tail Pipe devices, etc. • Set road map starting with least cost but max returns. Right combination of technology & fuel to combat auto emissions.
2.7 500 Worldwide – Diesel Quality Source - IFQC Despite WWFC effort, there is variance in approach to fuel quality.
Diesel Quality – Stakeholders’ needs • Excellent Lubricity to enhance life of fuel pump & engine parts. • Very Good fuel stability with least deposit formation tendency. • Better fuel filter performance. • Min viscosity limit to minimize / eliminate drip from injector. • Best fuel economy, acceptable emissions. • Lowest sulphur for longevity of tail pipe devices. • Lowest delivered cost to consumers. CN of 51 min is for high speed LCV running in Euro Autobahn. For heavy duty vehicles, NCWM (National Conference of Weights and Measures) specified 47CN Min. EMA recommended CN of 50min. Assessment of ‘Right Quality’ calls for a balanced approach.
Diesel Quality Change - India • India spends 26$ Billion / yr on diesel alone. • With Bharat III (similar to Euro III) grade in 13 metros, India spends additionally ~ 150MM$/yr on account of control spec of T95% in BS III. Cost of HSD Quality change - Did it provide the AQ benefits?
LCV – PM Vs Diesel grades Vs Technology Source - ARAI Euro II 0.08 gm/km Euro III 0.05 gm/km Euro IV 0.025 gm/km Technology plays a key role in abating vehicular emission..
HCV – PM Vs Diesel grades Vs Technology Source - ARAI Euro IV 0.03 gm/Kwh Euro II 0.15 gm/km Euro III 0.10 gm/km Euro IV 0.02 gm/km Technology plays a key role in abating vehicular emission..
Fuel Change CO HC NOx PM Reduce Density 0/ 0/ 0/ Reduce Poly-aromatics 0 / 0/ Reduce T90/95 0/ Reduce Sulphur Diesel Effects on Emissions - Summary Source - Shell Heavy Duty (Euro 2 / 3) 0 / implies conflicting results (dependent on engine technology) T95% has no impact on PM. However, it impacts diesel production.
Worldwide - Gasoline Quality ** Taiwan follows emission models to allow refiners to choose limits on olefins and aromatics. Japan does not have olefins or aromatics spec. and intends to meet emission norms with tail pipe & technology combination Despite WWFC effort, there is variance in approach to fuel quality.
Gasoline Quality – Stakeholders’ needs • Deposit Control (IVD, PFI, CCD, Carburetor rating, etc.) • Fuel Economy, better acceleration & Acceptable emissions. • Longer life of tail pipe cat. • Enhanced Engine / Component Life. • Lowest Delivered cost to consumers India mandated deposits control thru use of EPA regd additives.
Gasoline vehicles (2W) Emission test -HC No significant impact by Fuel. 2W technology near static till 2000.
Gasoline vehicles (2W) Emission test -CO No significant impact by Fuel. 2W technology near static till 2000.
Emission test – Cal. Fuel Economy Need to work on higher fuel efficiency vehicles to reduce GHG.
catalyst cars non catalyst cars HC Fuel Change CO NOx Benzene Exhaust. Evapn oxygenate Add aromatics Reduce Olefins Reduce Reduce Sulphur Reduce RVP Gasoline Effects on Emission - Summary Source: Shell
Clean Fuels - Redefined • Voice of stakeholders • Lessons learnt • Technological advancements • Product / Market segmentation approach
Vehicle Owners / Engine Operators Mostly unorganized barring STUs, Fleet operators, etc. Issues are:- • Cost of fuel and mileage sole concerns • No serious attention to vehicular emission - in-use vehicles. • Depend ‘next door garages’ for I & M needs. • Perception on fuel adulteration is high though reducing. • Restrained mobility arising from two fuel policy in India. • There is “Quality overkill’ in some sectors. Oil companies on most occasions address all these issues
OEMs The issues are: - • Engine warranty Vs ‘Right fuel’ availability / Adulteration • No firm vehicle retiring policy • Auto Garages – Consistency in Quality Output • Mismatch in auto fuel quality, which is neither on European nor Japanese model. • Reliability of tail pipe devices & synergy thereof with engine technology to combat auto emission. ‘One Nation One Fuel’ and or ensure right fuel to sustain mobility
Oil Companies The issues are: - • Mounting fuel bill and the need to innovate and supply ‘right fuels’ for appropriate end applications. • Wrath of unpleasant intervention by judicial and other lobbies – In the process put on reactive mode. • Tamper proof system of delivery to Retails and ability to demonstrate at forecourt. • Lopsided subsidies in fuels failing to reflect true cost to nation. Forums like I CAP, BIS and SIAM / Petrofed to lead the nation
80 PM NOx CO VOC 60 40 % reduction in mobile emissions 20 0 VEHICLES ONLY FUELS ONLY VEHICLES & FUELS TRAFFICMANAGEMENT Future Scenario Modeling - NZ IPIECA study Lessons Learnt - Factors on AAQ Vehicle technology impact is substantial than fuel quality.
Study Vehicle Technology Sulfur Range (ppm) Emissions Reduction, % (high to low sulfur) High Low HC CO NOx AQIRP Tier 0 450 50 18 19 8 EPEFE Stage 2+ 382 18 9 (52*) 9 (43*) 10 (20*) AAMA/AIAM LEV & ULEV 600 30 32 55 48 Effect of Sulphur change – Diesel vehicles * Reduction achieved during hot EUDC (extra-urban) portion of test.
Lessons Learnt - Gasoline Deposit Control Right MFA and not base gasoline quality helps to reduce deposits.
Olefins Spec – EU story Briefly, as far as history of the EU gasoline olefins spec is concerned, the EPEFE study, basis for EU Auto/Oil 1, did not investigate olefins effects as, at the time, this was not considered to be of sufficient priority - the emphasis was on aromatics, E100 and sulphur. Auto industry, however insisted on its inclusion into the air quality modeling stage, the argument put forward was that higher olefins were linked to higher NOx and hence higher ozone. The data for this came from the earlier US Auto/Oil (AQIRP) programme and was questionable, being based predominantly from non-catalyst vehicles or ones fitted only with Oxycats (no three-way catalyst vehicles - thus different from all the EPEFE data). Despite all this, politics prevailed & EU ended up with an olefins spec.
Source: Mico Cat devices reduce exhaust emission-NOx Tail pipe devices facilitate Euro II engine / vehicle technology with Euro II gasoline to comply with Euro III norms.
‘Right Fuel’ Campaign Diesel Source - Petrofed Urgency to differentiate diesel for on road & off road applications.
Proposed Roadmap on Fuel Segmentation Oil companies could ensure control in supply chain to reach right product to appropriate market.
Clean Fuels Redefined In short, there is a need to harness technology advancements in tail pipe devices, segment the market to use appropriate fuels and ‘twig’ the fuels to create “win – win” situations in combating air quality issues.
Diesel Fuel Quality - Proposed • AttributesUnitCurrentBharat IIITo be for Metros • Density kg/cum 820 - 860 820 - 845 820 – 860 ## • T95% recovery deg C 370max 360max 370 ## • Sulphur ppm 500 350 50 ^^ • Cetane Number - 48 min 51 min 48 min ## Adopt group average concept too. ^^ Encourage voluntary reduction by oil companies to help installation of tail pipe devices in older technology in-use vehicles.
Gasoline Fuel Quality - Proposed • Attribute Unit Current Euro III To be for Metros • Sulphur ppm m 500/150 150 <50 • Benzene % vol max 1 & 3 1 1 • Aromatics %vol max no spec 42 No spec • Olefins %vol max no spec 18 /21 No spec • Ethanol %vol max 5 Optional Optional Also, there is need to harmonize gasoline spec on BS II & BS III with respect to density & distillation. Mandate tail pipe devices thru retrofit in metros.
Forward path: • Critically examine Japanese Model including FQMs for appropriate inputs. • For Sustainable Mobility (safe and environment friendly transport solutions) right fuel availability across India is a must. • Mandate installation of tail pipe devices on all in-use vehicles plying in hot spots. • Segment fuels based on market needs and encourage retrofits in reducing exhaust emissions. • Emphasis only on induction of fuel efficient vehicles from 2007.
Emission Norms Emission norms for off road applications are different.
Emission norms (2W) Figs in gm/KM Indian two wheeler emission norms tougher than Europe and it is possible only due to perhaps better technology and use of tail pipe catalyst devices.
India’s growth forecast India is a fast growing economy in the region
India’s Energy needs – A profile Oil to continue the dominant role to fulfill India’s energy need
Crude Oil Geographical Production 2003-04 Source Petrofed Figs MMTPA Total 33.38MMTPA 4.24 0.66 4.67 17.68 6.13 India imports Crude oil ~ 70+MMTPA, this will be 140MTPA by 2012
Natural Gas Recoverable Reserves Source Petrofed Figs TCF Total = 54.13 TCF = 1163 MMTOE 13.09 6.28 34.76 Considering R/P ratio of gas reserves, Oil dependence to continue
Vehicular Emission Norms: Road Map *The schedules would be reviewed in end 2006 No forward path given for in-use vehicles as well retiring policy