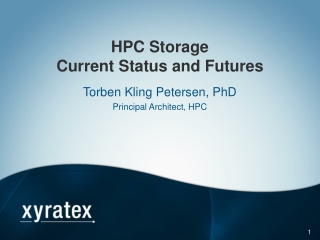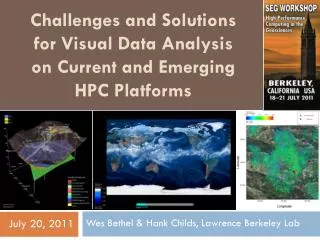
Challenges and Solutions for Visual Data Analysis on Current and Emerging HPC Platforms
160 likes | 296 Vues
As supercomputing evolves, the need for innovative visualization and analysis techniques grows, especially in the face of petascale data challenges. This discussion addresses the complexities of handling large-scale data, including issues related to memory and I/O performance. We explore "smart" techniques such as in situ processing and multi-resolution strategies that can help manage the increased demands of high-resolution simulations. Understanding and adapting to the changing landscape of HPC will be crucial for future visualization and analysis success.

Challenges and Solutions for Visual Data Analysis on Current and Emerging HPC Platforms
E N D
Presentation Transcript
Challenges and Solutions for Visual Data Analysis on Current and Emerging HPC Platforms Wes Bethel & Hank Childs, Lawrence Berkeley Lab July 20, 2011
Why are supercomputing trends going to change the rules for visualization and analysis? • Michael Strayer (U.S. DoE Office of Science) in 2006: “petascale is not business as usual” • Especially true for visualization and analysis! • Large scale data creates two incredible challenges: scale and complexity • Scale is not “business as usual” • Will discuss this assertion throughout this talk • Solution: we will need “smart” techniques in production environments • More resolution leads to more and more complexity • Will the “business as usual” techniques still suffice?
How does increased computing power affect the data to be visualized? High-res meshes Large # of variables / more physics Large ensembles Your mileage may vary; some simulations produce a lot of data and some don’t. Large # of time steps Slide credit: Sean Ahern (ORNL) & Ken Joy (UCD)
P2 P4 P1 P3 P0 P5 P8 P7 P6 P9 Today’s production visualization tools use “pure parallelism” to process data. Parallelized visualization data flow network Parallel Simulation Code Read Process Render Processor 0 Read Process Render P0 P1 P2 P3 Processor 1 P4 P5 P6 P7 Read Process Render Pieces of data (on disk) P8 P9 Processor 2
Pure parallelism • Pure parallelism: “brute force” … processing full resolution data using data-level parallelism • Pros: • Easy to implement • Cons: • Requires large I/O capabilities • Requires large amount of primary memory
“Petascale machine” Terascale machine I/O and visualization • Pure parallelism is almost always >50% I/O and sometimes 98% I/O • Amount of data to visualize is typically O(total mem) • Two big factors: • how much data you have to read • how fast you can read it • Relative I/O (ratio of total memory and I/O) is key Memory I/O FLOPs
Why is relative I/O getting slower? • I/O is quickly becoming a dominant cost in the overall supercomputer procurement. • And I/O doesn’t pay the bills. • Simulation codes aren’t as exposed. We need to de-emphasize I/O in our visualization and analysis techniques.
There are “smart techniques” that de-emphasize memory and I/O. • Out of core • Data subsetting • Multi-resolution • In situ • … the community is currently getting these techniques deployed in production tools. • This will be the primary challenge of the <100PFLOP era.
Exascale hurdle: memory bandwidth eats up the entire power budget • Hard to get data off the machine. • And we can’t read it in if we do get it off. • Hard to even move it around the machine. • Beneficial to process the data in situ. • . c/o John Shalf, LBNL
Possible in situ visualization scenarios We don’t know what the best technique will be for this machine. And it might be situation dependent. Visualization could be a service in this system (tightly coupled)… Physics #1 Physics #1 Physics #1 Physics #1 Physics #1 Physics #1 Physics #1 Physics #1 Physics #1 Physics #2 Physics #2 Physics #2 Physics #2 Physics #2 Physics #2 Physics #2 Physics #2 Physics #2 … … … … … … … … … … Physics #n Physics #n Physics #n Physics #n Physics #n Physics #n Physics #n Physics #n Physics #n Services Services Services Services Services Services Services Services Viz Viz Viz Services Viz Viz … or visualization could be done on a separate node located nearby dedicated to visualization/analysis/IO/etc. (loosely coupled) • We will possibly need to run on: • The accelerator in a lightweight way • The accelerator in a heavyweight way • A vis cluster (?) Specialized vis & analysis resources One of many nodes dedicated to vis/analysis/IO Viz Viz Accelerator, similar to HW on rest of exascale machine (e.g. GPU) … or maybe the data is reduced and sent to dedicated resources off machine! … or maybe this is a high memory quad-core running Linux! … And likely many more configurations Viz Viz
Additional exascale challenges • Programming language: • OpenCL? Domain-specific language? • We have a substantial investment in CPU code; we can’t even get started on migrating until language is resolved. • Memory efficiency • How do we explore data? • In situ reductions that are post-processed afterwards? • Resiliency • New types of data – massive ensembles, multi-physics, etc – will require new techniques • Reducing complexity
VisIt is an open source, richly featured, turn-key application for large data. • Terribly named!!!: • Visual debugging • Quantitative & comparative analysis • Data exploration • Presentations • Popular • R&D 100 award in 2005 • Used on many of the Top500 • >>>100K downloads 1 billion grid points / time slice 217 pin reactor cooling simulation Run on ¼ of Argonne BG/P Image credit: Paul Fischer, ANL
It has taken a lot of research to make VisIt work Systems research: Adaptively applying algorithms in a production env. Algorithms research: How to efficiently calculate particle paths in parallel. Scaling research: Scaling to 10Ks of cores and trillions of cells. Algorithms research: How to volume render efficiently in parallel. Algorithms research: Accelerating field evaluation of huge unstructured grids Methods research: How to incorporate statistics into visualization. Algorithms research: Reconstructing material interfaces for visualization Architectural research: Parallel GPU volume rendering Architectural research: Hybrid parallelism + particle advection Systems research: Using smart DB technology to accelerate processing
16K 16K, 32K Dawn Cray XT4 1T, 2T #cores Problem Size Model Machine 8K 0.5T IBM P5 Purple 1T 16K Cray XT5 Ranger Franklin 1T X86_64 Juno 32K 2T Sun JaguarPF 64K 4T BG/P VisItrecently demonstrated good performance at unprecedented scale. • Weak scaling study: ~62.5M cells/core Two trillion cell data set, rendered in VisIt by David Pugmire on ORNL Jaguar machine 14
The VisIt team focuses on making a robust, usable product for end users. • Manuals • 300 page user manual • 200 page command line interface manual • “Getting your data into VisIt” manual • Wiki for users (and developers) • Revision control, nightly regression testing, etc • Executables for all major platforms • Day long class, complete with exercises Slides from the VisIt class
More developers Entering repo all the time Partnership with CEA is developed Project started UC Davis & UUtah research done in VisIt repo VACET is funded Developers from LLNL, LBL, & ORNL Start dev in repo AWE enters repo LLNL user community transitioned to VisIt GNEP funds LLNL to support GNEP codes at Argonne 2005 R&D100 SciDAC Outreach Center enables Public SW repo Institutional support leverages effort from many labs Saudi Aramco funds LLNL to support VisIt User community grows, including AWE & ASC Alliance schools 2003 2007 2007 2004-6 ‘07-’08 ‘07-’08 2000 2005 Summer‘07 Spring ‘08 Spring ‘07 VisItis a vibrant project with many participants. • Over 75 person-years of effort • Over 1.5 million lines of code • Partnership between: Department of Energy’s Office of Science, National Nuclear Security Agency, and Office of Nuclear Energy, the National Science Foundation XD centers (Longhorn XD and RDAV), and more…. Fall ‘06 2008