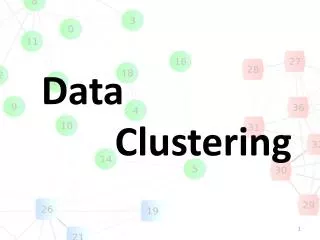
Unsupervised Data Clustering Overview
Explore the fundamentals of clustering in data analysis, including K-means algorithm and hierarchical clustering methods. Learn how to identify and encode interesting data structures effectively.

Unsupervised Data Clustering Overview
E N D
Presentation Transcript
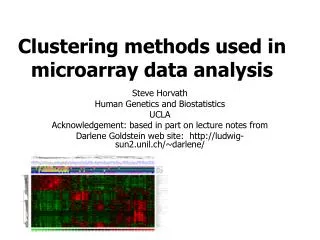
Clustering and Visual Data Analysis Bob Durrant School of Computer Science University of Birmingham (Slides: Dr Ata Kabán)
The Clustering Problem Unsupervised Learning Data (input) ‘Interesting’ structure (output) • Interesting: • contains essential characteristics • discards unessential details • provides a summary the data (e.g. to visualise on the screen) • compact • interpretable for humans • etc. Objective function that expresses our notion of interestingness for this data
One reason for clustering of data • Here is some data • Assume you transmit the coordinates of points drawn randomly from this data set • You are only allowed to send a small (say 2 or 3) bits per point • So it will be a lossy transmission • Loss = sum of squared errors between the original and the decoded coordinates • What encoder / decoder will lose the least information?
Formalising • What objective does K-means optimise? • Given an encoder function ENC:RT{1..K} (T is dimension of data, K is number of clusters) • Given a decoder function DEC:{1..K}RT • DISTORTION:=sum n{xn-DEC[ENC(xn)]}2 where DEC(k)=μk are centers of clusters, k=1..K So, DISTORTION=sumn{xn-μENC(xn)}2, where n goes from 1 to N, the number of points
The minimal distortion DISTORTION=sumn{xn-μENC(x_n)}2 This is minimised. What properties do μ1,…μK satisfy for that? 1) each point xn must be encoded by its nearest center, otherwise DISTORTION could be reduced by replacing ENC(xn) with the nearest center of xn. 2) each μk must be the centroid of its own points
If N is the known number of points and K the desired number of clusters, the K-means algorithm is: Begin initialize 1, 2, …,K (randomly selected) do classify n samples according to nearest i recompute i until no change in i return 1, 2, …, K End
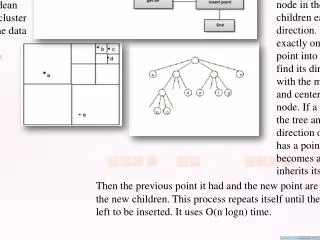
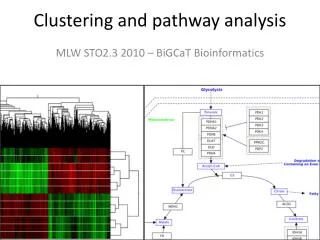
Other forms of clustering • Many times, clusters are not disjoint, but a cluster may have subclusters, in turn having sub-subclusters. • Hierarchical clustering
Given any two samples x and x’, they will be grouped together at some level, and if they are grouped a level k, they remain grouped for all higher levels • Hierarchical clustering tree representation called dendrogram
The similarity values may help to determine if the grouping are natural or forced, but if they are evenly distributed no information can be gained • Another representation is based on set, e.g., on the Venn diagrams
Hierarchical clustering can be divided in agglomerative and divisive. • Agglomerative (bottom up, clumping): start with n singleton cluster and form the sequence by merging clusters • Divisive (top down, splitting): start with all of the samples in one cluster and form the sequence by successively splitting clusters
Agglomerative hierarchical clustering • The procedure terminates when the specified number of clusters has been obtained, and returns the clusters as sets of points, rather than the mean or a representative vector for each cluster
The problem of the number of clusters • Typically, the number of clusters is known. • When it’s not, that is a hard problem called model selection. There are several ways of proceed. • A common approach is to repeat the clustering with c=1, c=2, c=3, etc.
What did we learn today? • Data clustering • K-means algorithm in detail • How K-means can get stuck and how to take care of that • The outline of Hierarchical clustering methods
Pattern ClassificationFind out more here!Pattern Classification (2nd ed) by R. O. Duda, P. E. Hart and D. G. Stork, John Wiley & Sons, 2000
Pattern ClassificationFind out more here!Pattern Classification (2nd ed) by R. O. Duda, P. E. Hart and D. G. Stork, John Wiley & Sons, 2000