Spectral Visual Clustering Tendency
This paper presents SpecVAT, a novel approach to enhancing visual cluster analysis using spectral techniques to improve the clustering process. The method begins with constructing a similarity matrix and leveraging the Laplacian matrix for clustering in a transformed space. SpecVAT utilizes visual assessment tools like VAT (Visual Assessment of Cluster Tendency) to determine the number of clusters and measure cluster validity through within-cluster and between-cluster variance. The algorithms demonstrate effective clustering and clarity in visual representation, enabling better interpretation of data structures.

Spectral Visual Clustering Tendency
E N D
Presentation Transcript
L. Wang, X. Geng, J. C. Bezdek, C. Leckie, and K. Ramamohanarao, “SpecVAT: Enhanced visual cluster analysis,” in Proceedings of the Eighth IEEE International Conference on Data Mining, 2008. (ICDM ’08), Dec. 2008, pp. 638–647. School of Engineering, The University of Melbourne, Vic 3010, Australia Spectral Visual Clustering Tendency
Conventional K-means Clustering 4) Steps 2 and 3 are repeated until convergence has been reached. 3) The centroid of each of the k clusters becomes the new means. 1) k initial "means" (in this case k=3) 2) associating every observation with the nearest mean. How to determine the k?
Determining the Number of Clusters • Determining Before Clustering Cluster Tendency Analysis • Determining After Clustering Cluster Validity Measurement Cluster Tendency Analysis Cluster Validity Measurement Clustering Input Output
Visual Analysis of Cluster Tendency (VAT) Scatter plot of a 2D data set Unordered image I(D) Reordered VAT image I(D’) J. C. Bezdek and R. J. Hathaway. VAT: A tool for visual assement of (cluster) tendency. In Proc. International Joint Conference on Neural Networks, pages 2225–2230, 2002.
Dissimilarity Matrix n objects Dissimilarity Image Dissimilarity Matrix 5 D 1 3 d12 4 2 Dissimilarity between objects oi and oj Scatter plot of a 2D data set
Reordered Dissimilarity Matrix 5 1 3 D d12 4 2 Reordering 5 4 3 D 2 1
VAT Algorithm Dissimilarity Image Dissimilarity Matrix 5 1 3 Max Dissimilarity 4 2 D 5 4 3 2 1
Problem of VAT Scatter plot Reordered VAT Image
Scatter plots of 9 synthetic data sets. From left to right and from top to bottom: S-1 ∼ S-9
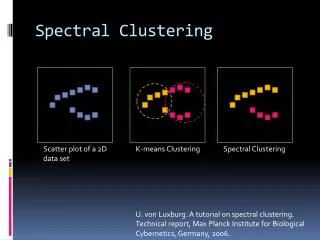
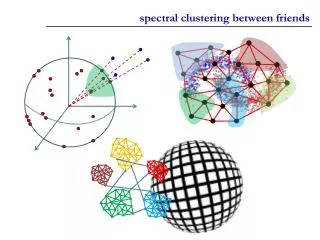
Spectral Clustering Scatter plot of a 2D data set K-means Clustering Spectral Clustering U. von Luxburg. A tutorial on spectral clustering. Technical report, Max Planck Institute for Biological Cybernetics, Germany, 2006.
Spectral Graph Connected Groups Similarity Graph
Similarity Graph Similarity Graph Vertex Set Weighted Adjacency Matrix Similarity Graph
Similarity Graph • ε-neighborhood Graph • k-nearest neighbor Graphs • Fully connected graph Gaussian Similarity Function ε-neighborhood K-nearest neighbor ε
Spectral Graph Connected Groups Similarity Graph
Graph Laplacian L: Laplacian matrix W: adjacency matrix D: degree matrix
Example W: adjacency matrix D: degree matrix 1 2 3 4 5 Similarity Graph L: Laplacian matrix
Property of Graph Laplacian • L is symmetric and positive semi-definite. • The smallest eigenvalue of L is 0, the corresponding eigenvector is the constant one vector 1. • L has n non-negative, real-valued eigenvalues 0= λ 1 ≦ λ 2 ≦ . . . ≦ λ n. L: Laplacian matrix 1 2 3 4 5 Similarity Graph
Eigenvalue and Eigenvector of Graph Laplacian Connected Component Constant Eigenvector
Example L: Laplacian matrix 1 2 3 4 5 Similarity Graph Two Connected Components Double Zero Eigenvalue Eigenvectors: f1= [1 1 1 0 0]’ f2= [0 0 0 1 1]’
Example First Two Eigenvectors W: adjacency matrix 1 2 3 4 5 Similarity Graph For all block diagonal matrices, the spectrum of L is given by the union of the spectra of Li
Spectral Clustering First k Eigenvectors New Clustering Space 1 2 3 4 5 Use k-means clustering in the new space Similarity Graph
Spectral Clustering Scatter plot of a 2D data set K-means Clustering Spectral Clustering
Spectral VAT (SpecVAT) Scatter plots Reordered VAT Image
SpecVAT Algorithm 1. Construct Similarity Matrix W 2. Construct Laplacian Matrix L 3. Choose First k Eigenvectors u1,…,uk 4. Construct New Dissimilarity Matrix D’ Data
SpecVAT Images Original VAT Image SpecVAT Images with Different k Desired Result
SpecVAT Image Analysis VAT Images Histogram of VAT Images “Good” VAT Image “Clarity” and “Block Structure”
SpecVAT Image Analysis Within-Cluster Between-Cluster Within-Cluster Variance σW Between-Cluster Variance σB Desired Distribution: Small σW and σB
“Goodness” Measurement of VAT Images T Test All T=1~255 to find the smallest σB Within-Cluster Variance σW Between-Cluster Variance σB Desired Distribution: Small σW and σB
Determining the Number of Clusters Test All k=1~kmax to find the smallest σB Scatter plots of S-1 data Scatter plots of S-5 data
Visual Clustering Scatter plot Good Partition Bad Partition C1 C2 C3 C1 C2 C3
Visual Clustering Scatter plot Good Partition Bad Partition C1 C2 C3 C1 C2 C3
Visual Clustering Scatter plot Good Partition Bad Partition Dark within-region and Bright between -region C1 C1 C2 C2 C3 C3
Visual Clustering Scatter plot Good Partition Dark within-region and Bright between -region C1 C2 C3 Genetic Algorithm is Applied in Paper
Result VAT Images S-1 S-2 S-3 Scatter plots Original VAT Images SpecVAT Images
Result VAT Images S-4 S-5 S-6 Scatter plots Original VAT Images SpecVAT Images
Result VAT Images S-4 S-5 S-6 Scatter plots Original VAT Images SpecVAT Images
Results [27] L. Zelnik-Manor and P. Perona. Self-tuning spectral clustering. In Proc. Advances in Neural Information Processing Systems, 2004.
Conclusions • The VAT is enhanced by using spectral analysis. • Based on SpecVAT, the cluster structure can be estimated by visual inspection. Number of clusters can be automatically estimated.