Download
1 / 23
240 likes | 484 Vues
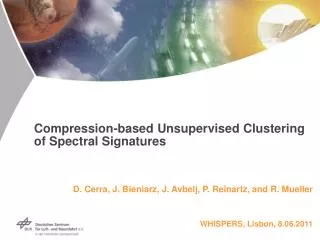
Compression-based Unsupervised Clustering of Spectral Signatures . D. Cerra, J. Bieniarz, J. Avbelj, P. Reinartz, and R. Mueller WHISPERS, Lisbon, 8.06.2011. Contents. CBSM as Spectral Distances Traditional Spectral distances NCD as spectral Distance. Introduction. Compression-based

E N D
Compression-based Unsupervised Clustering of Spectral Signatures D. Cerra, J. Bieniarz, J. Avbelj, P. Reinartz, and R. Mueller WHISPERS, Lisbon, 8.06.2011
Contents CBSM as Spectral Distances Traditional Spectral distances NCD as spectral Distance Introduction Compression-based Similarity Measures How to quantify Information? Normalized Compression Distance
Contents CBSM as Spectral Distances Compression-based Similarity Measures Introduction
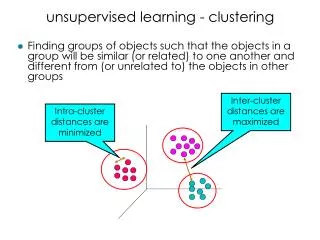
Similar! Not Similar! Introduction • Many applications in hyperspectral remote sensing rely on quantifying the similarities between two pixels, represented by spectra: • Classification / Segmentation • Target Detection • Spectral Unmixing • Spectral distances • Mostly based on vector processing • Any different (and effective) similarity measure out there?
Contents CBSM as Spectral Distances Introduction Compression-based Similarity Measures How to quantify Information? Normalized Compression Distance
How to quantify information? Two approaches Algorithmic VS. Probabilistic (classic) Information Uncertainty Shannon Entropy Information Complexity Kolmogorov Complexity Related to a random variableX with probability mass functionp(x) Measure of the average uncertainty in X Measures the average number of bits required to describe X Computable Related to a single object (string)x Length of the shortest program q among Qx programs which outputs the string x Measures how difficult it is to describe xfrom scratch Uncomputable
Mutual Information in Shannon/Kolmogorov Algorithmic (Statistic) Mutual Information Algorithmic Mutual Information VS. Probabilistic (classic) • Measure in bits of the amount of information a random variable X has about another variable Y • The joint entropyH(X,Y)is the entropy of the pair (X,Y) with a joint distribution p(x,y) • Symmetric, non-negative • If I(X;Y) = 0 then • H(X;Y) = H(X) + H(Y) • X and Yare statistically independent • Amount of computational resources shared by the shortest programs which output the strings x and y • The joint Kolmogorov complexityK(x,y) is the length of the shortest program which outputs x followed by y • Symmetric, non-negative • If then • K(x,y) = K(x) + K(y) • x and yare algorithmically independent
NID (x, y) = Normalized Information Distance (NID) Li - Vitányi • Normalized length of the shortest program that computes x knowing y, as well as computing yknowing x • Similarity Metric • NID(x,y)=0 iff x=y • NID(x,y)=1 -> maximum distance between x and y • The NID minimizes all normalized admissible distances
Compression: Approximating Kolmogorov Complexity • Big problem! The Kolmogorov complexity K(x) is uncomputable! • K(x) represents a lower bound for what an off-the-shelf compressor can achieve when compressing x • What if we use the approximation: • C(x) is the size of the file obtained by compressing x with a standard lossless compressor (such as Gzip) A Original size: 65 Kb Compressed size: 47 Kb B Original size: 65 Kb Compressed size: 2 Kb
C(x) x Coder C(xy) NCD Coder y Coder C(y) Normalized Compression Distance (NCD) • Approximate the NID by replacing complexities with compression factors • If two objects compress better together than separately, it means they share common patterns and are similar!! • Advantages • Basically parameter-free (data-driven) • Applicable with any off-the-shelf compressor to diverse datatypes
Evolution of CBSM • 1993 Ziv & Merhav • First use of relative entropy to classify texts • 2000 Frank et al., Khmelev • First compression-based experiments on text categorization • 2001 Benedetto et al. • Intuitively defined compression-based relative entropy • Caused a rise of interest in compression-based methods • 2002 Watanabe et al. • Pattern Representation based on Data Compression (PRDC) • First in classifying general data with a first step of conversion into strings • 2004 NCD • Solid theoretical foundations (Algorithmic Information Theory) • 2005-2010 Many things came next… • Chen-Li Metric for DNA classification (Chen & Li, 2005) • Compression-based Dissimilarity Measure (Keogh et al., 2006) • Cosine Similarity (Sculley & Brodley, 2006) • Dictionary Distance (Macedonas et al., 2008) • Fast Compression Distance (Cerra and Datcu, 2010)
Compression-Based Similarity Measures: Applications Clustering and classification of: • Simple Texts • Dictionaries from different languages • Music • DNA genomes • Volcanology • Chain letters • Authorship attribution • Images • …
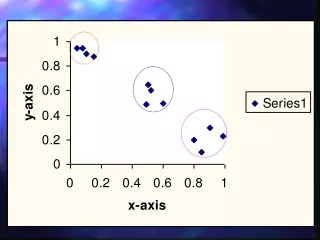
How to visualize a distance matrix? • An unsupervised clustering of a distance matrix related to a dataset can be carried out with a dendrogram (binary tree) • A dendrogram represents a distance matrix in two dimensions • It recursively splits the dataset in two groups containing similar objects • The most similar objects appear as siblings
An all-purpose method: application to DNA genomes Primates Rodents Clustered by
Stromboli Volcano Explosions Landslides Volcanology SeparateExplosions(ex) from Landslides (Ls)
Forest Desert City Fields Clouds Sea Optical Images Hierarchical Clustering 60 Spot 5 subsets, spatial resolution 5m
SAR Scene Hierarchical Clustering 32 TerraSAR-X subsets, Acquired over Paris, spatial resolution 1.8m False Alarm
Contents CBSM as Spectral Distances Traditional Spectral distances NCD as spectral Distance Introduction Compression-based Similarity Measures
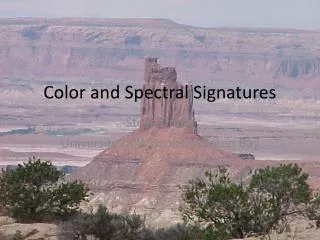
41 spectra From Aster 2.0 Spectral Library Spectra belonging to different rocks may present a similar behaviour or overlap Mafic Felsic Shale Rocks Categorization
Some well-known Spectral Distances Spectral Angle Euclidean Distance Spectral Correlation Spectral Information Divergence
1 2 3 4 6 5 7 2 1 1 2 1 4 2 3 3 4 5 8 3 6 6 7 4 5 9 7 8 Results • Evaluation of the dendrogram through visual inspection • Is it possible to cut the dendogram to separate the classes? • How many objects would be misplaced given the best cuts?
Conclusions • The NCD can be employed as a spectral distance, and may provide surprising results • Why? • The NCD is resistant to noise • Differences between minerals of the same class may be regarded as noise • The NCD (implicitly) focuses on the relevant information within the data • We guess that the analysis benefits from considering the general behaviour of the spectra • Drawbacks • Computationally intensive (spectra have to be analyzed sequentially) • Dependent to some extent on the compressor used • In every case the best compressor for the data at hand should be used, which approximates at best the Kolmogorov complexity