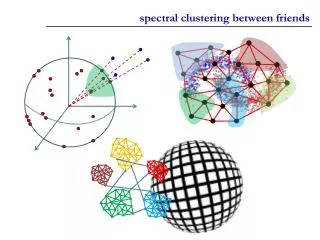
Spectral Clustering
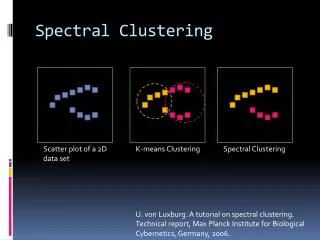
Spectral Clustering. Scatter plot of a 2D data set. K-means Clustering. Spectral Clustering. U. von Luxburg . A tutorial on spectral clustering. Technical report, Max Planck Institute for Biological Cybernetics, Germany, 2006. Conventional K-means Clustering.

Spectral Clustering
E N D
Presentation Transcript
Spectral Clustering Scatter plot of a 2D data set K-means Clustering Spectral Clustering U. von Luxburg. A tutorial on spectral clustering. Technical report, Max Planck Institute for Biological Cybernetics, Germany, 2006.
Conventional K-means Clustering 4) Steps 2 and 3 are repeated until convergence has been reached. 3) The centroid of each of the k clusters becomes the new means. 1) k initial "means" (in this case k=3) 2) associating every observation with the nearest mean. How to determine the k?
Spectral Graph Connected Groups Similarity Graph
Similarity Graph Similarity Graph Vertex Set Weighted Adjacency Matrix Similarity Graph
Similarity Graph • ε-neighborhood Graph • k-nearest neighbor Graphs • Fully connected graph Gaussian Similarity Function ε-neighborhood K-nearest neighbor ε
Spectral Graph Connected Groups Similarity Graph
Graph Laplacian L: Laplacian matrix W: adjacency matrix D: degree matrix
Example W: adjacency matrix D: degree matrix 2 1 3 4 5 Similarity Graph L: Laplacian matrix
Property of Graph Laplacian L is symmetric and positive semi-definite. The smallest eigenvalue of L is 0, the corresponding eigenvector is the constant one vector 1. L has n non-negative, real-valued eigenvalues 0= λ 1 ≦ λ 2 ≦ . . . ≦ λ n. L: Laplacian matrix 2 1 3 4 5 Similarity Graph
Eigenvalue and Eigenvector of Graph Laplacian Connected Component Constant Eigenvector
Example L: Laplacian matrix 2 1 3 4 5 Similarity Graph Two Connected Components Double Zero Eigenvalue Eigenvectors: f1= [1 1 1 0 0]’ f2= [0 0 0 1 1]’
Example First Two Eigenvectors W: adjacency matrix 2 1 3 4 5 Similarity Graph For all block diagonal matrices, the spectrum of L is given by the union of the spectra of Li
Spectral Clustering First k Eigenvectors New Clustering Space 2 1 3 4 5 Use k-means clustering in the new space Similarity Graph
Spectral Clustering Scatter plot of a 2D data set K-means Clustering Spectral Clustering