Download
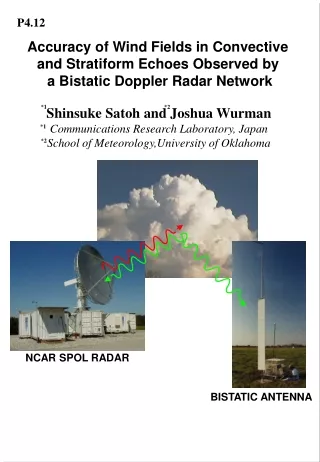
1 / 35
350 likes | 453 Vues
This study assesses ASCAT wind vectors through statistical analysis, comparing with buoy data. Findings highlight global wind speed histograms and directional distributions for enhancing wind retrieval algorithms.

E N D
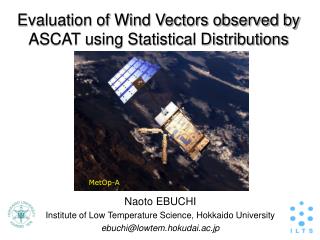
Evaluation of Wind Vectors observed by ASCAT using Statistical Distributions Naoto EBUCHI Institute of Low Temperature Science, Hokkaido University ebuchi@lowtem.hokudai.ac.jp MetOp-A
Outline • Comparison of ASCAT wind vectors with data from ocean buoys • Assessment of statistical distributions of ASCAT wind speeds and directions • Global wind speed histograms • Directional distributions relative to antenna beams • Applications to Oceansat-II scatterometer
Buoy Data for Comparison with ASCAT • Data Period - From 20 Nov. 2008 to 31 Dec. 2010 • Collocation - Dr < 12.5 km, Dt<10 min. • Height and Stability Collections - Liu and Tang (1996) Code - 10-m height Neutral Equivalent Wind NDBC KEO NDBC TAO RAMA WHOI PIRATA
Comparison of ASCAT Winds with Buoy Data # Bias RMS Correlation Wind Speed (m/s) 27,247 -0.15 1.42 0.885 Wind Direction (deg.) U > 0 m/s 26,976 3.0 26.2 0.957 U > 3 m/s 23,750 2.7 17.4 0.979 U > 5 m/s 18,672 2.7 14.1 0.985
Calculation of Global Statistics of ASCAT Wind Speeds and Directions • ASCAT 25 km Swath Products (L2) • 1 Jan. 2010 – 31 Dec. 2010 (1 year) • Global ocean, 60oS – 60oN • Collocated ECMWF winds (Non-EN wind) • 156 million data points
ASCAT Global Wind Speed Histograms Period: 1 Jan. 2010 – 31 Dec. 2010 (1 year) Area: global ocean, 60oS – 60oN Bin size: 1 m/s
ECMWF Wind Speed Histograms Collocated with ASCAT observations
Statistics of ASCAT Wind Speed Distribution 12.5 km Product NWP ASCAT
ASCAT Wind Direction Histograms WVC# 1-3 WVC# 4-6 WVC# 7-9 WVC# 10-12 WVC# 13-15 WVC# 16-18 WVC# 19-21 ECMWF ASCAT Left Swath, Wind Speed Range: 7-9 m/s, Descending Paths
Normalized ASCAT Wind Direction Histograms WVC# 1-3 WVC# 4-6 WVC# 7-9 WVC# 10-12 WVC# 13-15 WVC# 16-18 WVC# 19-21 Descending Ascending Normalized (ASCAT/NWP), Left Swath, Wind Speed Range: 7-9 m/s
Wind Speed Dependence of Normalized Wind Direction Histograms (Outer Cells) 3-5 m/s 5-7 m/s 7-9 m/s 9-11 m/s 11-13 m/s 13-15 m/s Descending Ascending Normalized (ASCAT/NWP), WVC#: 1-3 (Left Outer Swath)
Wind Speed Dependence of Normalized Wind Direction Histograms (Mid Cells) 3-5 m/s 5-7 m/s 7-9 m/s 9-11 m/s 11-13 m/s 13-15 m/s Descending Ascending Normalized (ASCAT/NWP), WVC#: 10-12 (Left Mid Swath)
Wind Speed Dependence of Normalized Wind Direction Histograms (Inner Cells) 3-5 m/s 5-7 m/s 7-9 m/s 9-11 m/s 11-13 m/s 13-15 m/s Descending Ascending Normalized (ASCAT/NWP), WVC#: 19-21 (Left Inner Swath)
Applications to data from Oceansat-II scatterometer Oceansat-II Scatteromter (OSCAT) Ku-band (13.51 GHz) Scanning dual pencil beam VV and HH pol 50 km resolution 1800 km swath
Comparison of OSCAT Winds with Buoy Data # Bias RMS Correlation Wind Speed (m/s) 8,938 0.56 1.65 0.893 Wind Direction (deg.) U > 0 m/s 8,835 -0.2 32.4 0.938 U > 3 m/s 7,550 -0.3 22.3 0.968 U > 5 m/s 6,130 -0.4 14.1 0.977
OSCAT Global Wind Speed Histograms Period: 1 Jan. 2010 – 31 Dec. 2010 (1 year) Area: global ocean, 60oS – 60oN Bin size: 1 m/s
ECMWF Wind Speed Histograms Collocated with OSCAT observations
Statistics of OSCAT Wind Speed Distribution OSCAT Dec NWP OSCAT Asc ECMWF Asc ECMWF Dec
OSCAT Wind Direction Histograms WVC# 1-3 WVC# 4-6 WVC# 7-9 WVC# 10-12 WVC# 13-15 WVC# 16-18 ECMWF OSCAT Left Swath, Wind Speed Range: 7-9 m/s, Ascending Paths
Summary • ASCAT wind speeds and directions agrees well with buoy observations in general. • ASCAT global wind speed histogram varies with cross-track cell location. This trend is clearly represented by statistical parameters, such as standard deviation, skewness and kurtosis. • Directivity relative to the antenna beams is discernible for ASCAT wind directions. • At low wind speeds and the outer cells (high incidence), most of wind vectors aligned to the flight direction or mid-beam direction. • These results suggest the needs for further refinements of the wind retrieval algorithms and the C-band GMF.
Residuals of Wind Speed and Direction Binning wind speed = (Ubuoy + Uscat)/2
Dependence of Wind Speed Residual on Wave Parameter Significant Wave Height Inverse Wave Age Correlation Coefficient = 0.300 Correlation Coefficient = -0.311
Comparison of wind speed OSCAT
Residuals of Wind Speed and Direction OSCAT Binning wind speed = (Ubuoy + Uscat)/2
Statistics of NSCAT Wind Speed Distribution ASCAT ASCAT ASCAT ASCAT (Ebuchi, J. Oceanogr., 2000)
Statistics of QSCAT Wind Speed Distribution Descending Ascending ASCAT ASCAT ASCAT ASCAT
Histograms of ERS-1 Wind Directions CMOD-4 CMOD-IFR2 (Ebuchi & Graber, JGR, 1998)
Histograms of NSCAT Wind Directions (Ebuchi, JGR, 1999)
Histograms of QSCAT Wind Directions (Ebuchi, Proc. IGARSS 2000, 2000)
Rough estimation of incidence angle error • Based on the SASS-2 GMF (Wentz et al., 1984) • At an incidence angle of q = 57o, VV-pol., and wind speed of U10 = 10 m/s, d s 0 / d q = – 0.3 dB d s 0 / d U10= 0.7 dB • An error of 1o in incidence angle may cause an error of 0.4 m/s in wind speed.