Download
1 / 16
160 likes | 298 Vues
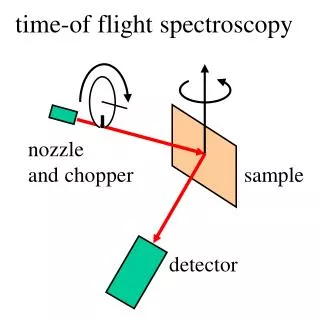
position and time of flight from emma bpm data. Jim Crisp updated 17 November 2010. data. from ALICE log 25-Sep-10 100925_160005 thru 161145 log indicates 40pC see 14pC (assuming 20pC/13mVpk) 800pC/140mV x 7 (17db amp) x 1/2 (50m Ecoflex-15) from Alex Kalinin Tektronix TDS6124C

E N D
position and time of flight from emma bpm data Jim Crisp updated 17 November 2010
data • from ALICE log 25-Sep-10 • 100925_160005 thru 161145 • log indicates 40pC • see 14pC (assuming 20pC/13mVpk) • 800pC/140mV x 7 (17db amp) x 1/2 (50m Ecoflex-15) • from Alex Kalinin • Tektronix TDS6124C • 100,000 samples (~170 turns) • 100pSec/sample • analyzed using Matlab
gaussian filter • use gaussian filter to remove septum signal and limit bandwidth • second order gaussian band pass filter • center at 630MHz • bandwidth 500MHz • 100pSec samples 50pSec samples • b1 = 1.9047872e-2 0.5378698e-2 • b3 = -3.8095745e-2 -1.0757395e-2 • b5 = 1.9047872e-2 0.5378698e-2 • a2 = -3.2104587 -3.6531892 • a3 = 4.0634898 5.0650061 • a4 = -2.3905939 -3.1579361 • a5 = 0.55571202 0.74744295
first 15 turns (red) with/without filter • fft of first 15 turns in red, rotation harmonics marked with red dot • every 4th harmonic is missing • button separation close to ¼ turn. • gaussian filter removes low frequency from septum/kicker pulse
171 turns with filter red indicates samples used for analysis green is the turn before injection
correlate with orthogonal wavelets first and last turns
Synchronize ‘wavelet’ to beam • Oscilloscope samples are asynchronous with rotation frequency • difference of up to +/-1/2 sample • +/-50pSec • 3 steps • calculate dt assuming constant frot • shift wavlets by dt before correlation • add shift to result
position and charge average stdev for all 13 files is 0.11mm
time of flight(wrt constant frequency) red 1301.1MHz blue 1301.2MHz (neg for shorter tof)
delay between buttons average stdev for all 13 files is 4pSec
effect of noise • added white gaussian noise to bpm signal • equivalent noise at Tektronix TDS 6124C input • 0.12 to 0.18mV rms
Tektronix TDS6124C oscilloscope • error from 8bit resolution • 0.11mV rms with 10mV/div • typical noise TDS6124C 10mV/div • dsp on 0.57mV rms • dsp off 0.67mV rms • data suggests 0.12 to 0.18mV rms
Tektronix TDS6124C oscilloscope • clock stability • 1ppm typical • 9.6pSec/173 turns • delta time accuracy (<100nSec) • 0.635pSec rms (6.35ppm) • ~turn to turn error (neglecting noise) • trigger jitter • <1 pSec rms typical
conclusion • charge at injection 14.6 to 6.9pC • alice log indicates 40pC • 18 to 31% remaining after 170 turns • observed position and tof rms error consistent with Tektronix TDS6124C bit resolution • +/-0.1mm rms and +/-4.0pSec rms • (roughly inversely proportional to intensity)