Download
1 / 21
220 likes | 332 Vues
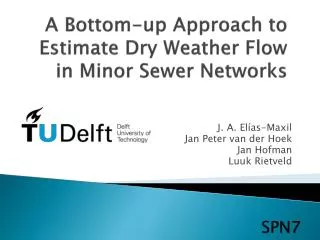
A Bottom-up Approach to Estimate Dry Weather Flow in Minor Sewer Networks. J. A. Elías-Maxil Jan Peter van der Hoek Jan Hofman Luuk Rietveld . SPN7. Motivation. Sustainability of the urban water cycle 80 % of energy input to urban water is heat

E N D
A Bottom-up Approach to Estimate Dry Weather Flow in Minor Sewer Networks J. A. Elías-Maxil Jan Peter van der Hoek Jan Hofman Luuk Rietveld SPN7
Motivation • Sustainability of the urban water cycle • 80 % of energy input to urban water is heat • Strategies to improve sustainability: Heat recovery installations • Operates in main sewers • Significant potentialfor heat recovery in smallsewers
Motivation • To estimate the potential temperatureand flowdata is needed • Flow measurements are some times difficult to obtain in small sewers • Low flow rates • Intermittent • Difficult access • Costly
Motivation • Prediction of wastewater flow with little and if possible no measurements • Possibility to calculate intermittent wastewater flow • Possibility to use the flow patterns to calculate wastewater quality (temperature)
Related research • Wastewater flow modeling in sewer (a) • Probability theory to produce expected flow • Intermittentdischarges from water consuming appliances were converted to continuous base flow • The flow rate and arrival time at a certain point of the sewer was modeled with Saint Venant equations (a) Butler, D. and N. J. D. Graham (1995). J. Environ. Eng. 121(2): 161-173.
Model approach • Stochastic modeling(Drinking water) • Generation of water pulses • Different for every activity • Adapted to wastewater discharge • Attenuation of intermittent flow Blokker, E. J. M., et al. (2010). Jour. Water. Res. Plan. and Man. 136(1): 19-26.
Case Study • North of Amsterdam • 97 household connections • Clustered in 51 connections for the model • ~ 15 days • Geometry • Mean slope < 2% • PVC 250 mm • 2 Monitoring campaigns
Measurements • Flow measurement by pumping time
Modeling approach • Generation of wastewater discharge patterns
Modeling approach • Generation of wastewater discharge patterns |: Separation of sub-activities or cycles *: The same parameter was included in the remaining 3 cycles
Modeling approach • Generation of wastewater discharge patterns
Comparison • Mean flow rate / day • Maximum flow rate in time period / day Flow patterns divided in time segments (6s – 1hr) Qmean & Qmax Percentiles of cumulative results obtained Comparison: RMSE R2
Results *Expected flow from surveys: 0.4 l/s
Conclusions • A model that includes • Stochastic simulation of drinking water demand • Transformation of pulses to wastewater generation • Attenuation of discharge to the sewer Was found to be adequate to model the wastewater flow rate of a small sewer • The prediction was stable for time frames from 6 seconds to 1 hour • RMSE ~ 20% • R2 > 85% • Future work: Validation of temperature model
Temperature Model Along the pipe Along the Distance of the pipe Along the water depth
Acknowledgements Thank you!
A1. Measurements • Detection of pump intervals
A2.Measurements • Effect of time resolution • Level readings Error analysis of measurements • Hydraulic model calibration • Roughness • Pump capacity