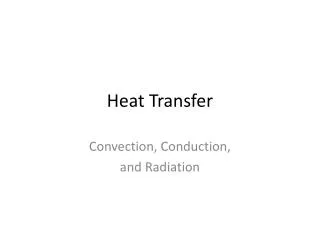
Boiling Heat Transfer in ITER First Wall Hypervapotrons
260 likes | 799 Vues
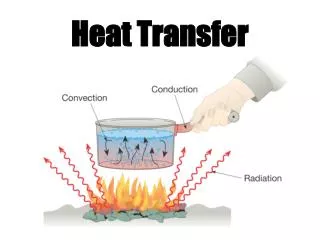
FNST/MASCO/PFC Meeting. Boiling Heat Transfer in ITER First Wall Hypervapotrons. Dennis Youchison, Mike Ulrickson and Jim Bullock Sandia National Laboratories Albuquerque, NM August 6, 2010.

Boiling Heat Transfer in ITER First Wall Hypervapotrons
E N D
Presentation Transcript
FNST/MASCO/PFC Meeting Boiling Heat Transfer in ITER First Wall Hypervapotrons Dennis Youchison, Mike Ulrickson and Jim Bullock Sandia National Laboratories Albuquerque, NM August 6, 2010 Sandia is a multiprogram laboratory operated by Sandia Corporation, a Lockheed Martin Company,for the United States Department of Energy’s National Nuclear Security Administration under contract DE-AC04-94AL85000. 1
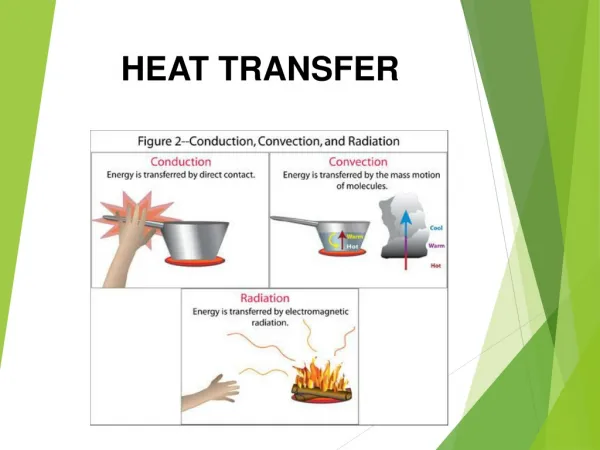
Outline • What are hypervapotrons? • Why hypervapotrons? • Geometry optimization • Boiling heat transfer in hypervapotrons • Why CFD? • Benchmarking with HHF test data • CHF prediction 2
Background • Star-CCM+ Version 5.04.006, User Guide, CD-adapco, Inc., New York, NY USA (2010). • S. Lo and A. Splawski, “Star-CD Boiling Model Development”, CD-adapco, (2008). • D.L. Youchison, M.A. Ulrickson, J.H. Bullock, “A Comparison of Two-Phase Computational Fluid Dynamics Codes Applied to the ITER First Wall Hypervapotron,” IEEE Trans. On Plasma. Science, 38 7, 1704-1708 (2010). • Upcoming paper in the 2010 TOFE . 3
Why hypervapotrons? • Advantages: • High CHF with relatively lower pressure drop • Reduction in E&M loads due to thin copper faceplate • Lower Cu/Be interface temperature (no ss liners) • Less bowing of fingers due to thermal loads • Disadvantages: • CuCrZr/SS316LN UHV joint exposed to water 5
What are hypervapotrons? Hypervapotron FW “finger” 6
Two-phase CFD in water-cooled PFCs • Problem: conjugate heat transfer with boiling • • Focus on nucleate boiling regime below critical • heat flux • • Use Eulerian multiphase model in FLUENT & Star-CCM+ • • RPI model (Bergles&Rohsenow) • • Features heat and mass transfer between liquid • and vapor, custom drag law, lift or buoyancy and influence of bubbles on turbulence • CCM+ transitions to a VOF model for the film when vapor fraction is high enough – need to know when to initiate VOF 7
5 MW/m2 400 g/s t=2.05s Velocity distributions Drag on bubbles, lift or buoyancy, changes in viscosity and geometry, all affect the velocity distribution under the heated zone. 2mm-deep teeth and 3-mm spacing optimized to produce a simple reverse eddy in the groove. 8
Star-CCM+ 560 k polyhedra mesh Switches from Eulerian multi-phase mixture to VOF for film boiling. 9
Star-CCM+ Results CCM+ boiling models were benchmarked against US and Russian test data for rectangular channels and hypervapotrons to within 10oC. Case analyzed is a hot “stripe” on a section of the ITER first wall. Surface temperature distribution, t=6.3 s capability to predict CHF from CFD 10
With no boiling, heat transfer is highest under the fins With boiling, the vapor fraction in grooves is 4%-6% on average Star-CCM+ Results Case analyzed is a hot “stripe” on a section of the ITER first wall. The details of the heat transfer change dramatically as boiling ensues. Iso-surface of 2% vapor volume fraction t=6.3 s 11
Star-CCM+ gives same h as Fluentfor nucleate boiling. Heat transfer coefficients increase in grooves where boiling takes place ranging from 12,000 to 13,000 W/m2K. 12
Systematic parameter study performed on rectangular channels – then applied to hypervapotrons. 13
Thermocouple response 3.5 MW/m2 through 6 s Thermocouple response 4.0 MW/m2 through 6 s Russian data ICHF Trip @ 400 C Temperature (C) Not ss yet! Temperature (C) Rectangular channel results 14
Russian HV CHF Mock-up flow 15
Total of 490k poly cells in mesh 3 prism layers Heated area is 100 mm x 48 mm 16
Surface temperature – 6.0 MW/m2, 1 m/s 115 C inlet, 2 MPa 17
CCM+ solid/fluid interface temperatures for 6.0 MW/m2 @6s 18
Thermocouple response through 6 s 4 s for TCs to ss Russian data 20
All flow regimes can exist simultaneously. T: h: • sub-cooled • nucleate to transition boiling • film boiling • sub-cooled 4.0 MW/m2 115 oC, 2 MPa water 1.0 m/s 22
CHF Testing Testing of the HV mock-up T/C (1.5 mm from CuCrZr surface) Water 2 m/s Pabs 10 MW/m2 tpuls 300s Second pulse at 10 MW/m2) ICHF ! 23