Ecology
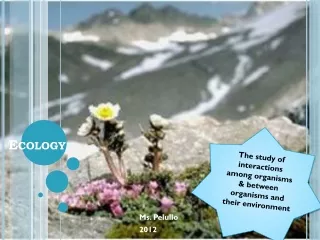
Ecology. Climate Drives Ecology. Both the sun and the seasonal variation of the earth impact ecology. The sun is the primary provider for energy for all of life. The seasons (due to the tilt in the earth’s axis(~23.5°)) create variability and change in the environment.

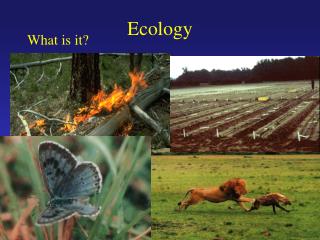
Ecology
E N D
Presentation Transcript
Climate Drives Ecology Both the sun and the seasonal variation of the earth impact ecology. The sun is the primary provider for energy for all of life. The seasons (due to the tilt in the earth’s axis(~23.5°)) create variability and change in the environment.
Water and it’s Impact on Climate Water is warmed at the equator and flows towards the poles, where it cools. The water can moderate climate of nearby land.
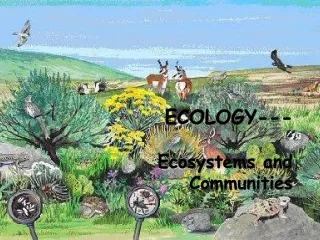
Aquatic Biomes Make up most of the largest of all biomes. Similarly diverse as terrestrial biomes. Characterized by their physical environment: salt, light, soils, and biotic factors.
Zonation in Aquatic Biomes • Zonation depends upon: • 1) Light penetration • 2) Distance from shore and water depth • 3) Open water vs. bottom
Population Ecology Studying what variables affect, influence, and drive populations of organism. • What drives a population? • Density • Dispersion • Demography
Population Density Number of individuals in a given area. Density is constantly in flux; individuals are being added or removed all the time.
Dispersion: Spacing of individuals in a population Populations may vary how they space themselves for various reasons. Protection Territoriality Mating Feeding
Demography – the vital statistics and how they change Done by following a cohort from birth until death. Each year the number of individuals are determined and the proportion of surviving members is calculated.
Methods of Displaying Population Death Rate: Life Table Life Table
Survivorship Curve Visual representation of life tables 3 Major types: I – low early death rates and a steep drop in death at older ages. II – relatively constant rate of death of the life span of the population. III – high death rates for young and lower death rates for older individuals.
Population Growth In order for a population to grow these criteria must be met to some degree.
Exponential Growth If access to food and reproduction are unlimited and there are no restrictions a population may grow exponentially. J-shaped Maximum rate of increase is constant, but the number of individuals over time at a greater rate. Seen in populations introduced to new environments or those rebounding.
Logistic Growth Unlimited resources are rarely seen. As the population density increases, resource availability decreases. There is a limit to the number of individuals that the environment can support: Carrying Capacity (K). As K is reached, the population will remain relatively constant, fluctuating slightly.
Population Growth and Natural Selection: How and why do Populations Grow?
Population Growth Regulation • Density Dependent • Density Independent • If a birth or death rate is influenced by the population density. • Competition for resources • Predation due to availability • Waste accumulation • Disease • Territoriality If a birth or death rate is NOT influenced by the population density.
Ultimately Populations Fluctuate Yearly – Population Dynamics
Ecological Niche An ecological niche is related to an organism’s “position” in a community (think job). The “job” is related to its ability to rather resources effectively and allow for that organism to reproduce and thrive. 2 species competing for the same resources in the same area cannot coexist – competitive exclusion suggests that the slight differences in the species will lead to some ecological advantage for one species, leading to the elimination of the less fit species.
Community Interactions are Classified Based on Help, Harm, or no Effect
Community Structure: Trophic Levels • Autotrophs (primary producer) • Herbivores (primary consumer) • Carnivores (secondary, tertiary, etc. consumer) • Detritivores (decomposer) Energetic hypothesis: Food chain length limited by inefficiency of energy transfer (~10% per “link”). Dynamic Stability hypothesis: Long food chains are less stable due to magnification up each link.
Disturbance and it’s Impact on the Community Disturbance can create species diversity and improve the overall survival of a community. Some species rely on disturbances to complete their life cycle New York Pine Barrens
Ecological succession in Glacier Bay, Alaska after glacier retreat:
Overview of Energy and Nutrient Dynamics in an Ecosystem Energy limits ecosystem production! Without enough energy input primary producers cannot support trophic levels above them. The same can be said for various nutrients: limiting nutrients.
Ecosystem Energy Budget • Despite the large amount of solar radiation that bombards the earth daily, only a small amount is used in photosynthesis. ~1% is used for photosynthesis! • GPP = amount of energy from light converted to chemical energy. • NPP = GPP – energy used by primary producers to make energy. This is the energy available to consumers – the energy that moves up the food chain/web.
Energy Transfer Between Trophic Levels Much of the energy consumed by an organism in a trophic level above consumers is lost to heat through undigested feces, respiration, etc. ~1/6 energy consumed is used for growth (secondary production).
Trophic Efficiencies Amount of product transferred from one trophic level to the next. Much of the energy from one trophic level is lost due to heat. ~10% of the available energy is passed to the next trophic level.
Similar Trends are Established for Biomass and Density But Why???
Biogeochemical Cycles For each of the biogeochemical cycles please note: Biological importance Forms available to life Reservoirs – biotic or abiotic accumulations of a particular chemical that living things draw nutrients from and also return the nutrient to Key processes – driving factors for each cycle