Download
1 / 72
720 likes | 827 Vues
Explore challenges, disparities in healthcare, IOM reports, minority health disparities, and disparities in cardiac care and satisfaction rates. Understand the impact of income and race on access, quality of care, and preventive services. Key topics include identifying disparities, setting priorities, and measuring the effectiveness of quality improvement initiatives.

E N D
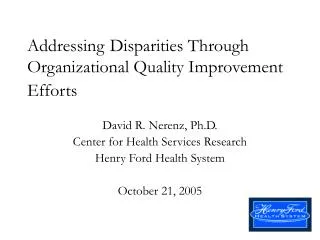
AddressingDisparities Through Organizational Quality Improvement Efforts David R. Nerenz, Ph.D. Center for Health Services Research Henry Ford Health System October 21, 2005
Overview • Health Care Disparities • Reasons for Disparities • Hospitals, Health Plans, and Quality Improvement • Three Challenges: • Identifying Significant Disparities • Measuring Effects of QI Initiatives • Setting Priorities
IOM Report, 2002: Assessing the Quality of Minority Health Care “Disparities in the health care delivered to racial and ethnic minorities are real and are associated with worse outcomes in many cases, which is unacceptable.” -Alan Nelson, retired physician, former president of the American Medical Association and chair of the committee that wrote the Institute of Medicine report, Unequal Treatment: Confronting Racial and Disparities in Health Care
Ratio of Minority-White Death Rates, 1994-1996 Death rates of minority Americans compared to those of white Americans at various ages 3.0 African American 2.0 American Indian/Alaska Native White, non-Latino Latino 1.0 Asian/Pacific Islander 0.0 0-14 15-24 25-44 45-64 65+ Age Groups Ratios are based on deaths per 100,000 resident population SOURCE: DHHS Health, Unites States, 1998
Screening: Percent with Early Stage Cancer* Among Women with Breast Cancer, 1978-1987 (Detroit) *Tumors <2cm and no auxiliary lymph involvement at diagnosis SOURCE: Swanson, M et al., 1990
Indicators of Children’s Access to Care, 1987 Adjusted Odds Ratios Minority Children vs. White Children 2.44 Ratios > 1.0 indicate minority more likely than white children 2.12 1.77 1.54 1.45 0.56 Has a usual Source of Care Does not see a specific physician No After-hours Emergency Care Travel time of 30 min. + Wait time of 60 min. + Physician Not Seen for Selected Symptoms DATA: 1987 NMES SOURCE: Newacheck et at, 1996
Heart Procedure Rates for Blacks and Whites, 1980 vs.1993 (Ratio of Black/White procedure rates) * Ratios <1.0 indicates Blacks less likely than Whites to undergo procedure Equal procedure rate 1980 1993 1980 1993 1980 1993 Cardiac Catheterization Bypass Surgery Angioplasty • Rates were age-adjusted • SOURCE: Gillum R.F., et al., 1997
Whites African Americans Coronary Artery Surgery Rates by Race and Disease Severity, 1984-1992 Percent Receiving Bypass Surgery Mild Disease Severe Disease Source: Peterson, et al., 1997.
Disparities in Cardiac Revascularization • 5,000 Medicare beneficiaries in 5 states – 1991 and 1992 • RAND appropriateness criteria • Some gender disparities noted as well • Epstein et al, Medical Care, 2003
Evidence of racial/ethnic differences in cardiac care1984-2001 11 studies find no racial/ethnic difference in care (14%) 68 studies find a racial/ethnic difference in care (84%) 2 studies find racial/ethnic minority group more likely than whites to receive appropriate care (2%) Source: Kaiser Family Foundation Total= 81 studies
THE COMMONWEALTH FUND Minorities are Less Satisfied with The Quality of Care They Receive Percent adults 19-64 privately insured *Significantly different from whites at p<.05 or less Source: The Commonwealth Fund Biennial Health Insurance Survey (2003)
Rates of Hospitalization for Coronary Artery Bypass Surgery Among Medicare Beneficiaries, 1993 Coronary Artery Bypass Surgery Procedures per 1000 beneficiaries per year* 4.9 4.8 4.8 4.6 2.2 2.2 2.1 1.8 <$13,001 $13,001- $16,300 $16,301- $20,500 >$20,500 Annual Income *Rates were adjusted for age and sex to the total Medicare population. SOURCE: Gomick, ME et al., 1996
Infant Mortality Rates: Mothers 20+ Years by Education and Race/Ethnicity, 1995 College + HighSchool Less than High School Infant deaths per 1,000 live births DATA:CDC National Center for Health Statistics SOURCE: DHHS. Health, United States, 1998
Across Income Groups, African Americans Are Most Likely to Go without Needed Care Because of Cost Percent adults 19-64 privately insured going without needed care ^Did not fill prescription, did not get specialist care, or skipped recommended test because of cost. *Significantly different from whites at p<.05 or better Source: The Commonwealth Fund Biennial Health Insurance Survey (2003)
THE COMMONWEALTH FUND Across Income Groups – Hispanics Are Most At Risk for Forgoing Preventive Care Percent adults 19-64 privately insured with blood pressure check inpast year *Significantly different from whites at p<.05 or better Source: The Commonwealth Fund Biennial Health Insurance Survey (2003)
Evidence on Disparities “Racial and ethnic minorities tend to receive a lower quality of health care than non-minorities, even when access-related factors, such as patient’s insurance status and income, are controlled. ” (my emphasis) IOM Report, Unequal Treatment: Confronting Racial and Ethnic Disparities in Health Care, 2002
Some of these studies are pretty old – haven’t things changed since people started studying this?
Reperfusion Therapy in Medicare Beneficiaries with Acute MI Canto JG, Allison JJ, Kiefe CI, Fincher CI, Farmer R, Sekar P, Person S, Weissman NW. Relation of race and sex to the use of reperfusion therapy in Medicare beneficiaries with acute myocardial infarction. N Engl J Med 2000 Apr 13;342(15):1094-100
Disparities in Management of AMI – Changes Over Time (1994-2002) • Data Source – NRMI • 600,000 Patients • Significant disparities in several measures; no change over time • Some disparities became not significant in adjusted analyses • Vaccarino et al, NEJM, August 18, 2005
Receipt of Major Surgical Procedures – Medicare Data 1992-2001 • Focus on 9 surgical procedures • Analysis by hospital referral regions for three procedures • No evidence of change in disparity over 10-year period • Disparity reduction in 22/158 regions, but no elimination of disparity in any region • Jha et al, NEJM, August 18, 2005
Disparities in Medicare Managed Care (HEDIS) Measures Over Time • Standard, widely-used quality measures • Trends from 1997 or 1999 to present • Improvements in quality overall, reduction in disparities in some HEDIS measures, but not all • Trivedi et al, NEJM, August 18, 2005
Disparities in Medicare Managed Care (HEDIS) Measures Over Time (Cont.) • Additional HEDIS measures • Change in disparity from first to most recent year • Trivedi et al, NEJM, August 18, 2005
All of these studies involve large national samples – what about disparities within single health care organizations?
Comprehensive Diabetes Care:Foot Exam Performed Rate White vs. African American (p<0.001), White vs. Hispanic (p<0.001) and White vs. Asian (p<0.001).
Asthma: Outpatient Follow-up After Acute Episodes • Core concept: Outpatient follow-up after either ER visit or admission • Children 5-17 years old • Standard based on national expert panel guidelines
Comparison of non-Hispanic/Hispanic Breast Cancer Screening by Commercial, Medicare Risk, and Medicaid Products in a Single Health Plan, 2000 P=.001 non-Hispanic population
Environmental Factors Income/Poverty Insurance coverage Geographic access Poor-quality facilities and providers in minority neighborhoods Cultural competence of providers and systems Language barriers “Institutional racism” Individual Factors Cultural beliefs and preferences Trust in providers and organizations (lack of) Literacy Biased clinical decision-making Some possible biological differences Possible Explanations for Disparities
Conceptual Model of Health Care Disparities Patient Factors Health Care System Factors Treatments Outcomes Environmental Factors Provider Factors
Conceptual Model of The Operation of a Car Engine Factors Chassis and Body Factors Movement of Car Arrival at Destination Environmental Factors Driver Factors
Understanding the Provider Contribution to Disparities Provider Characteristics Setting (Michelle VanRyn) Provider Interpretation of Symptoms Provider cognition and affect regarding patient Pt Race/ethnicity Treatment or Service Pt Received Provider Decision-making (Diagnosis,Treatment) Pt Behavior in Encounter (e.g., question-asking self-disclosure, assertiveness) Provider Behavior in Encounter (e.g., participatory style, warmth, content, information giving, question-asking) Class Encounter characteristics Pt Satisfaction Pt Behavior (e.g. self management, information-seeking, utilization) Pt Cognitive & Affective Factors (e.g., acceptance of advice, attitude, self-efficacy, intention, feelings of competence, attitude toward med care, trust) Culture
CHRONOLOGY BIRTH DIAGNOSIS TREATMENT No chemotherapy, SCLC / advanced NSCLC INNATE Age Sex / Gender No surgery, localized NSCLC Race / ethnicity (B vs. W) No Rx, any Socioeconomic status EXPOSURES / ACQUIRED FACTORS Marital status (spouseless) Smoking status (current) SURVIVAL Illicit drug (use vs. not) Comorbidities (adverse) DIAGNOSTIC INTENSITY Unstaged cancer Histology NOS CANCER-RELATED Symptoms (adverse) Stage (higher / advanced)
Conceptual Model for Contribution of Race/Ethnicity and SES to Treatment and Outcome Disparities Education Literacy SES Income Financial Access Job Class Historical Bias/ Discrimination Benefits, Schedule Flexibility Disparities in Outcomes Disparities in Treatment Comprehension, Trust Language Health Beliefs, Trust in Providers Race/Ethnicity Culture Biological Differences Tumor Histology, Comorbidities Bias/Discrimination in Medical Settings
Disparities in Cardiac Surgery – Steps in a Process • Notice and interpret symptoms • Get primary care doctor appointment • Get tests • Deal with insurance and payment issues • Get referral to Cardiology • Get Cardiology appointment • Get additional tests • Discuss treatment options and ask questions • Get referral to Cardiac Surgeon • Get appointment with surgeon • Get additional tests • Discuss treatment options and ask questions • Get surgery scheduled • Arrange time off work and family support • Deal with comorbid conditions • Get surgery
Disparities in Breast Cancer Treatments and Outcomes Bynum et al Lipscombe et al Comorbidities, Obesity Mammography Bibb, Mandelblatt, Others Tammemagi et al, Griggs et al Yood et al, Others Stage at Diagnosis Treatment by Stage Survival Hershman et al, Dignam Stark et al Histology Chlebowski et al Grann et al
Understanding Underlying Factors – Role of Comorbidities • Comorbidities as mediators of treatment choices, or of treatment effectiveness • Comorbidities as predictors of survival or other health outcomes, independent of treatment for primary condition being studied • Higher prevalence of comorbidities (e.g., hypertension, diabetes) among minority patients.
Survival Disparities in Breast Cancer – Role of Comorbidities • Comorbidity and Survival Disparities Among Black and White Patients With Breast Cancer • C. Martin Tammemagi, PhD; David Nerenz, PhD; Christine Neslund-Dudas, MA; Carolyn Feldkamp, PhD; David Nathanson, MD JAMA. 2005;294:1765-1772. • Approximately 900 Black and White Women with Breast Cancer, 10-Year Follow-up
Comorbidities and Breast Cancer (Cont.) • African American women more likely than White women to have comorbidities • Comorbidities associated with survival • Comorbidities explained most of the disparity in all-cause survival, but not in cancer-specific survival.
Disparities in Lung Cancer Outcomes HR (Black vs. White) = 1.21 (95% CI 1.05, 1.38; p = 0.008) Median survival Blacks = 8.5 months; Whites = 11.2 months
Kaplan Meier survival plots for 1154 LCA patients, stratified by Adverse comorbidity Adverse symptoms
Predictors of LCA survival – hazard ratios & distributions (OR) by race/ethnicity
Why Think About Disparities in Terms of Quality of Care? • Relatively strong science base of published literature and evidence-based guidelines conceptual and moral clarity • Build on existing staff, data collection infrastructure, and organizational relationships • Build on existing QI concepts, models, and approaches
Disparities in Standard Hospital Measures of Quality of Care • JCAHO/CMS Standard Measure Set • CHF • AMI • Pneumonia • Commonwealth Fund – HRET Project • RWJF Initiative – “Expecting Success”
CMS/JCAHO Measures for CHF and AMI * Percent *
Analysis of Disparities – Basic Requirements • Well-defined, accepted measures of quality, access, satisfaction, clinical outcomes • Data on race/ethnicity, SES, primary language
Methods of Data Collection – Direct from Members/Patients • Pros: • Most Flexible • Generally Preferred for Accuracy • Cons: • Can be Expensive • Can Raise Concerns about Health Plan’s Real Objectives
Methods of Data Collection – Geocoding • Pros: • Relatively Easy, Fast, and Inexpensive • Requires only Information you Already Have • Cons: • Won’t Work in Residentially Integrated Areas • Won’t Identify Small, Dispersed Groups
Methods of Data Collection – Surname Recognition • Pros: • Relatively Easy, Fast, and Inexpensive • Can be Combined with Geocoding • Cons: • Only Works for Groups with Distinct Names • May not Work in All Market Areas