Download
1 / 26
260 likes | 484 Vues
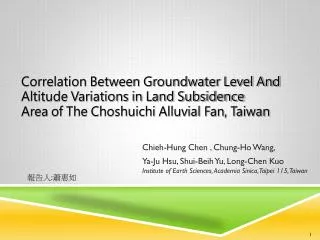
Correlation Between Groundwater Level And Altitude Variations in Land Subsidence Area of The Choshuichi Alluvial Fan, Taiwan. Chieh-Hung Chen , Chung-Ho Wang, Ya-Ju Hsu, Shui-Beih Yu, Long-Chen Kuo Institute of Earth Sciences, Academia Sinica, Taipei 115, Taiwan. å ±å‘Šäºº : è•æƒ 如. Introduction.

E N D
Correlation Between Groundwater Level And Altitude Variations in Land SubsidenceArea of The Choshuichi Alluvial Fan, Taiwan Chieh-Hung Chen , Chung-Ho Wang, Ya-Ju Hsu, Shui-Beih Yu, Long-Chen KuoInstitute of Earth Sciences, Academia Sinica, Taipei 115, Taiwan 報告人:蕭惠如
Introduction • In Taiwan, groundwater resources have been depleted in the western and southwestern regions in the past decades due to excessive extraction and caused extensive land subsidence along coastal areas. • The most notorious land subsidence region is located at the Choshuichi Alluvial Fan of central Taiwan , with an active subsiding area of over 600 km2 and a maximum subsiding rate up to 10 cm/yr. In short, the groundwater level dropped from a value close to sea-level down to −30 m from 1974 to 2006
Fig. 1. Locations of the groundwater monitoring wells (open circles) and GPS sites (solid dots) in the Choshuichi Alluvial Fan of western Taiwan. The Choshui River flows through the middle of the fan and separates two sections: northern Changhua and southern Yunlin Counties. Groundwater flow directions are expressed in gray dashed arrows. The severe land subsidence is located in the southern area of the Yunlin County. Stations which are taken as examples and discussed in Figs. 5–7 are marked with open squares.
Table 1. The locations and observation aquifers of Choshuichi alluvial fan used in this study.
Because the Choshuichi Alluvial Fan can be divided into three aquifers for a depth of 250 m according to subsurface hydrogeology each station may have one to five screens situated in different wells for fully observing changes from shallow to deep aquifers. The groundwater levels of these aquifers indicate two major flow directions: northwest in Changhua county and southwest in Yunglin county
Fig. 2. Contours of groundwater level aquifer 1 from years of 1994–2005 versus 2006
In this study, we (Chen et al.) examine the correlation between the land subsidence (deduced from GPS data) and the groundwater level variations of monitoring wells in the period between 1994 and 2006. • Our (Chen et al.) aim is to quantitatively describe the relationship between vertical displacement on surface and groundwater level variation in identifying the distinctive effects among aquifers and derive the long-term trend for the land subsidence area. • The behavior of aquifers is vital to the understanding of land subsidence process. The long-term trend is very valuable in developing an effective and appropriate remediation strategy for the land and water resources management in a large scale.
Methodology • Taiwan GPS Network was firstly established by the Institute of Earth Sciences, Academia Sinica in 1989 . The number of continuous GPS sites had been rapidly increased to 320 after the 1999 Taiwan Chi-Chi earthquake. • In this study, we use GPS vertical displacements from two continuous sites, PKGM (RGPSPKGM; 23.5799°N, 120.3055°E) and S103(RGPSS103;23.5644°N, 120.4752°E) to analyze variations of vertical motions associated with groundwater levels from 1994 to 2006.
The groundwater-levels in the aquifers are recorded digitally every hour by piezometers. For a better and consistent comparison, records of the groundwater level and vertical displacement of GPS are both transferred as monthly data, RAaqST and RGPSST, where aq and ST denote the aqth aquifer and the station, respectively. • AaqST and GPSST, are respectively calculated as the yearly changes of the RAaqSTand RGPSST with a step of one month.
The linear relationship between the AaqST and GPSST can be written as: (1) where xaq and i denote the coefficients of the AaqST and the sequence numbers of monitor aquifers, respectively
Because responses of land subsidence caused by excessive extraction in groundwater are generally not constant, for simplification in analysis, the unknown long term trend is expressed by a temporal function of 4 orders since 1974, and is added into Eq. (1). Thus, the linear relationship between GPS and groundwater level can be rewritten as: (2) where y is the observation year and xj is the coefficient of the long term subsidence
Since recording the temporal period of the AaqST exceeds the unknown elements xaq and xj, the traditional least squares method is employed: (3) Here, A is the AaqST in a particular year (y−1974)j (y=1994 to 2006). B is the GPSST, and x represents the xaq and xj of Eq. (2).
When we solve the linear relationship, the synthetic surface variations (Sv) can be simultaneously given by A multiplied by x; and the obtained correlation coefficient (C.C.) serves as an index which expresses the strength and direction of a linear relationship between the GPSST and Sv. In general, when the C.C. is larger than 0.5, the relationship is mainly a positive correlation and the GPSST can be roughly estimated by the Sv.
aquifer 1 Observations and discussion for groundwater level data Fig. 2. Contours of groundwater level aquifer 1 from years of 1994–2005 versus 2006
aquifer 2 Fig. 3. Contours of groundwater level aquifer 2 from years of 1994–2005 versus 2006
aquifer 3 Fig. 4. Contours of groundwater level aquifer 3 from years of 1994–2005 versus 2006
To explore the relationship between the land subsidence and the groundwater level changes, records of two GPS observations, PKGM in the severe land subsidence area and S103 in a normal stable place, are compared with the groundwater variations of Peikang (PK) and Tungjung (TR) wells, Relationships of groundwater levels to GPS data
Relations between groundwater level variations and GPSPKGMvertical changes at the Paikang (PK) site. • Time-series variations of the raw GPS, groundwater data of aquifers 2 and 3. • Time-series variations of the raw GPS (shadow line) and groundwater data of aquifers 2 and 3 without seasnal effect and the correlations between them. The synthetic vertical changes are expressed as lines of solid dots without long term subsidence accounted) and open triangles (with long term subsidence accounted), respectively. • The deduced long term trend of the land subsidence relative to 1974. The shadow zone represents study data covering the Chi-Chi • earthquake.
Relations between groundwater level variations and GPSs103 vertical changes at the Tungjung (TR) site. • Time-series variations of the raw GPS s103 and groundwater data of aquifers 1, 2 and 3. • Time-series variations of the raw GPS (shadow line) and groundwater data of aquifers 1, 2 and 3 without seasonal effect, and the correlation between them. Line with solid dots shows the synthetic vertical changes without long term subsidence estimation. The shadow zone represents study data covering the Chi-Chi earthquak
Relations between groundwater level variations at the Tungkuang (TK) site and GPSPKGM vertical changes. (a) Time-series variations of the raw GPS (shadow line), groundwater data of aquifers 2 and 3 without seasonal effect and the correlations between them. The synthetic vertical changes are expressed as lines of solid dots (without long term subsidence accounted) and open triangles (with long term subsidence accounted), respectively. (b) The deduced long term trend of the land subsidence at the TK site. The shadow zone exhibits study data covering the Chi-Chi earthquake
Overdraft of groundwater in the Choshuichi Alluvial Fan has been the major mechanism for a negative impact of land subsidence. • The elevation changes in the subsidence area are primarily affected by two factors: (1)the current groundwater level variations and (2)a long term trend caused by the past excessive extraction in aquifers. The two factors can be separated and estimated by a linear relationship and temporal functions. Conclusions
In addition, the correlation coefficient between the synthetic and observed elevation changes can be served as an effective and quantitative indicator in differentiating the normal and/or subsidence area and weighting factor for various aquifers. • The results of this study can provide a useful reference of remediation strategy for the land and water resources management in active subsiding areas.