Ending Extreme Poverty: Sustainable Development's Impact
260 likes | 272 Vues
Explore poverty rates, MDGs, disease statistics, population growth, agricultural yields, and aid efforts in the age of sustainable development.

Ending Extreme Poverty: Sustainable Development's Impact
E N D
Presentation Transcript
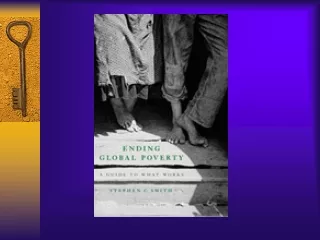
Lecture 5Ending Extreme Poverty The Age of Sustainable Development
5.1. Poverty Rates for the Developing World (1981-2008) Source: PovcalNet/World Bank.
5.2. Extreme Poverty Rates by Region Source: PovcalNet/World Bank.
5.3. The Eight Millennium Development Goals Source: UNDP Brazil.
5.4. Official list of MDG indicators http://unstats.un.org/unsd/mdg/Host.aspx?Content=Indicators/OfficialList.htm
5.5. AIDS treatment recipients (2002-2010) and AIDS deaths (2000-2010) Source: Joint United Nations Programme on HIV/AIDS (UNAIDS). http://www.un.org/millenniumgoals/pdf/MDG%20Report%202012.pdf
5.6. Malaria Deaths by Age and Region (1980-2010) Source: Murray, Christopher J. L. et al. 2012. “Global Malaria Mortality Between 1980 and 2010: A Systematic Analysis.” The Lancet 379: 413–431.
5.7. Gross National Income Per Capita (2011) Source: World Bank. 2014. “World Development Indicators.”
5.8. GDP Growth Annual Change (1990-2012) Source: International Monetary Fund. 2014. World Economic Outlook Database.
5.9. Average Crop Yields West, Paul C., Holly K. Gibbs, Chad Monfreda, John Wagner, Carol C. Barford, Stephen R. Carpenter, and Jonathan A. Foley. “Trading Carbon for Food: Global Comparison of Carbon Stocks vs. Crop Yields on Agricultural Land.” Proceedings of the National Academy of Sciences. November 1, 2010. doi:10.1073/pnas.1011078107.
5.10. World Fertilizer Use (1998) Source: AAAS Atlas of Population and Environment.
5.11. Lights at Night (NASA Satellite) Data courtesy Marc Imhoff of NASA Satellite GSFC and Christopher Elvidge of NOAA NGDC. Image by Craig Mayhew and Robert Simmon, NASA GSFC.
5.12. African Undersea Cables (2013) Map courtesy of Steve Song (http://manypossiblities.net).
5.13: UN Population Scenarios for sub-Saharan Africa (1950-2100) Source: United Nations Department of Economic and Social Affairs Population Division (DESA Population Division). 2013. “World Population Prospects: The 2012 Revision.” New York.
Figure 5.14. World Population Density (2013) Source: World Bank. 2014. “World Development Indicators.”
5.15. Norman Borlaug(left), M.S. Swaminathan(middle), Chidambaram Subramaniam(right) Photo courtesy of the Norman Borlaug Institute for International Agriculture at Texas A&M University. “Monkombu Sambasivan Swaminathan—Kolkata 2013-01-07.” Biswarup Ganguly, Wikimedia Commons, CC BY 3.0 Age Fotostock/DINODIA
5.16. Wheat Yields in Developing Countries Source: Food and Agriculture Organization of the United Nations. 2014. “Crops.” Latest update: 7/18/2014. http://faostat3.fao.org/faostat-gateway/go/to/download/Q/QC/E.
5.17. Wheat Yields in Mexico, India, Pakistan (1950-2000) Source: Food and Agriculture Organization of the United Nations. 2014. “Crops.” Latest update: 7/18/2014. http://faostat3.fao.org/faostat-gateway/go/to/download/Q/QC/E.
5.18. India’s Population (Medium-Variant after 2010) Source: United Nations Department of Economic and Social Affairs Population Division (DESA Population Division). 2013. “World Population Prospects: The 2012 Revision.” New York.
5.19. India’s Total Food Grain Production Per Capita (1951-2006) Source: Food and Agriculture Organization of the United Nations. 2014. “Crops.” Latest update: 7/18/2014. http://faostat3.fao.org/faostat-gateway/go/to/download/Q/QC/E.
5.20. Global Prevalence of Stunting Source: UN data.
5.21. BRAC Women’s Microfinance group Source: Grameen Foundation.
5.22. Total Fertility Rate in Bangladesh (1950-2015) Source: UN data.
5.23. Official Development Assistance (2012) Source: Organization for Economic Co-operation and Development. 2013. “Compare your country—Official Development Assistance 2013.” Paris: OECD. http://www.oecd.org/statistics/datalab/oda2012.htm.
5.24. Millennium Villages and Africa’s Agro-ecological zones From the Millennium Villages Project. http://www.unmillenniumproject.org/mv/mv_history.htm
Credit: YomboTankoano. http://1millionhealthworkers.org/2013/06/25/backpack-plus-project/ 5.25. CHW with a Backpack of Supplies