Download
1 / 7
70 likes | 95 Vues
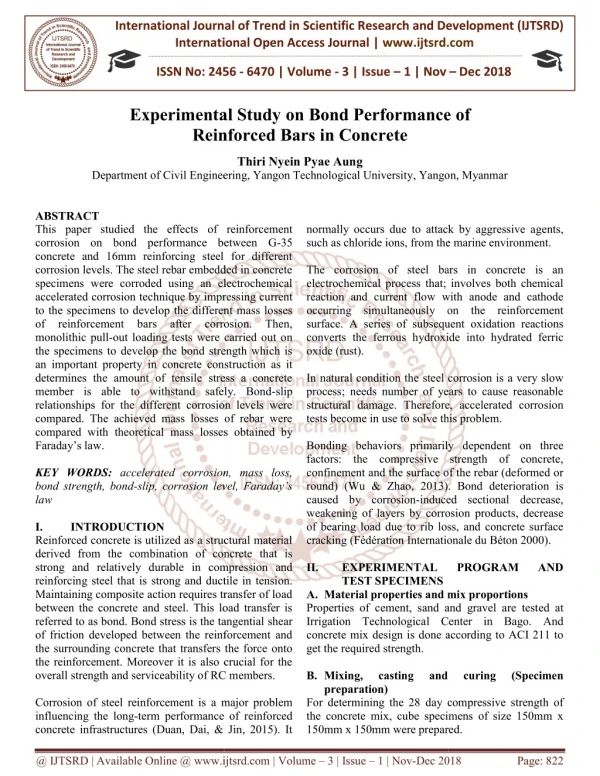
This paper studied the effects of reinforcement corrosion on bond performance between G 35 concrete and 16mm reinforcing steel for different corrosion levels. The steel rebar embedded in concrete specimens were corroded using an electrochemical accelerated corrosion technique by impressing current to the specimens to develop the different mass losses of reinforcement bars after corrosion. Then, monolithic pull out loading tests were carried out on the specimens to develop the bond strength which is an important property in concrete construction as it determines the amount of tensile stress a concrete member is able to withstand safely. Bond slip relationships for the different corrosion levels were compared. The achieved mass losses of rebar were compared with theoretical mass losses obtained by Faraday's law. Thiri Nyein Pyae Aung "Experimental Study on Bond Performance of Reinforced Bars in Concrete" Published in International Journal of Trend in Scientific Research and Development (ijtsrd), ISSN: 2456-6470, Volume-3 | Issue-1 , December 2018, URL: https://www.ijtsrd.com/papers/ijtsrd19049.pdf Paper URL: http://www.ijtsrd.com/engineering/civil-engineering/19049/experimental-study-on-bond-performance-of-reinforced-bars-in-concrete/thiri-nyein-pyae-aung<br>

E N D
International Journal of Trend in International Open Access Journal International Open Access Journal | www.ijtsrd.com International Journal of Trend in Scientific Research and Development (IJTSRD) Research and Development (IJTSRD) www.ijtsrd.com ISSN No: 2456 ISSN No: 2456 - 6470 | Volume - 3 | Issue – 1 | Nov 1 | Nov – Dec 2018 Experimental Study Reinforced Bars Reinforced Bars in Concrete Experimental Study on Bond Performance n Bond Performance of Thiri Nyein Pyae Aung Department of Civil Engineering, Yangon Technological University f Civil Engineering, Yangon Technological University, Yangon, Myanmar Yangon, Myanmar ABSTRACT This paper studied the effects of reinforcement corrosion on bond performance between G concrete and 16mm reinforcing steel for different corrosion levels. The steel rebar embedded in concrete specimens were corroded using an electrochemical accelerated corrosion technique by impress to the specimens to develop the different mass losses of reinforcement bars after corrosion. Then, monolithic pull-out loading tests were carried out on the specimens to develop the bond strength which is an important property in concrete const determines the amount of tensile stress a concrete member is able to withstand safely. Bond relationships for the different corrosion levels were compared. The achieved mass losses of rebar were compared with theoretical mass losses obta Faraday’s law. KEY WORDS: accelerated corrosion, mass loss, bond strength, bond-slip, corrosion level, Faraday’s law I. INTRODUCTION Reinforced concrete is utilized as a structural material derived from the combination of concrete that is strong and relatively durable in compression and reinforcing steel that is strong and ductile in tension. Maintaining composite action requires transfer of load between the concrete and steel. This load transfer is referred to as bond. Bond stress is the tangential of friction developed between the reinforcement and the surrounding concrete that transfers the force onto the reinforcement. Moreover it is also crucial for the overall strength and serviceability of RC members. Corrosion of steel reinforcement is a major problem influencing the long-term performance of reinforced concrete infrastructures (Duan, Dai, & Jin, 2015). It concrete infrastructures (Duan, Dai, & Jin, 2015). It normally occurs due to attack by aggressive agents, such as chloride ions, from the marine environment. The corrosion of steel bars in concrete is an electrochemical process that; involves both chemical reaction and current flow with anode and cathode occurring simultaneously on the reinforcement surface. A series of subsequent oxidation reactions converts the ferrous hydroxide in oxide (rust). In natural condition the steel corrosion is a very slow process; needs number of years to cause reasonable structural damage. Therefore, accelerated corrosion tests become in use to solve this problem. Bonding behaviors primarily dependent on three factors: the compressive strength of concrete, confinement and the surface of the rebar (deformed or round) (Wu & Zhao, 2013). Bond deterioration is caused by corrosion-induced sectional decrease, weakening of layers by corrosio of bearing load due to rib loss, and concrete surface cracking (Fédération Internationale du Béton 2000). II. EXPERIMENTAL TEST SPECIMENS A.Material properties and mix proportions Properties of cement, sand and gravel are test Irrigation Technological Center in Bago. And concrete mix design is done according to ACI 211 to get the required strength. B.Mixing, casting and preparation) For determining the 28 day compressive strength of the concrete mix, cube specimens of size 150mm x 150mm x 150mm were prepared. 150mm x 150mm were prepared. of reinforcement normally occurs due to attack by aggressive agents, such as chloride ions, from the marine environment. corrosion on bond performance between G-35 concrete and 16mm reinforcing steel for different corrosion levels. The steel rebar embedded in concrete specimens were corroded using an electrochemical accelerated corrosion technique by impressing current to the specimens to develop the different mass losses of reinforcement bars after corrosion. Then, out loading tests were carried out on the specimens to develop the bond strength which is an important property in concrete construction as it determines the amount of tensile stress a concrete member is able to withstand safely. Bond-slip relationships for the different corrosion levels were compared. The achieved mass losses of rebar were compared with theoretical mass losses obtained by bars in concrete is an electrochemical process that; involves both chemical reaction and current flow with anode and cathode occurring simultaneously on the reinforcement surface. A series of subsequent oxidation reactions converts the ferrous hydroxide into hydrated ferric In natural condition the steel corrosion is a very slow process; needs number of years to cause reasonable structural damage. Therefore, accelerated corrosion tests become in use to solve this problem. rimarily dependent on three factors: the compressive strength of concrete, confinement and the surface of the rebar (deformed or round) (Wu & Zhao, 2013). Bond deterioration is induced sectional decrease, weakening of layers by corrosion products, decrease of bearing load due to rib loss, and concrete surface cracking (Fédération Internationale du Béton 2000). accelerated corrosion, mass loss, slip, corrosion level, Faraday’s Reinforced concrete is utilized as a structural material derived from the combination of concrete that is relatively durable in compression and reinforcing steel that is strong and ductile in tension. Maintaining composite action requires transfer of load between the concrete and steel. This load transfer is referred to as bond. Bond stress is the tangential shear of friction developed between the reinforcement and the surrounding concrete that transfers the force onto the reinforcement. Moreover it is also crucial for the overall strength and serviceability of RC members. EXPERIMENTAL PROGRAM PROGRAM AND AND Material properties and mix proportions Properties of cement, sand and gravel are tested at Irrigation Technological Center in Bago. And concrete mix design is done according to ACI 211 to Mixing, casting and curing curing (Specimen (Specimen a major problem For determining the 28 day compressive strength of the concrete mix, cube specimens of size 150mm x term performance of reinforced @ IJTSRD | Available Online @ www.ijtsrd.com www.ijtsrd.com | Volume – 3 | Issue – 1 | Nov-Dec 2018 Dec 2018 Page: 822
International Journal of Trend in Scientific Research and Development (IJTSRD) ISSN: 2456 International Journal of Trend in Scientific Research and Development (IJTSRD) ISSN: 2456 International Journal of Trend in Scientific Research and Development (IJTSRD) ISSN: 2456-6470 Before mixing the concrete, the reinforcement bars were carefully cleaned. The mass of the reinforcement bars in each specimen was recorded, and the bars were aligned and fastened to the moulds. A mould releasing compound was applied to the inside surfaces of the specimen moulds. Compaction was performed with a table vibrator. After pouring and compacting the concrete, the specimen surface was smoothed with a steel trowel. The concrete specimens were kept in a curing room maintained at 22 °C (±2 °C) and 90% relative humidity for 24 h. Demoulding and transportation of the specimens were conducted with great care to avoid any disturbance of the reinforcement bars. After demoulding, the specimens were cured in a water tank at 22 °C (±2 °C) for 28 days. Each rebar sample was weighed prior to casting using an analytical balance with precision of 0.01 g. After which they were subjected t corrosion test; whereas the concrete cubes were tested for compressive strength at the age of 28 days. C.Accelerated corrosion test The known methods to accelerate corrosion are the following: (i) acceleration by a cyclic test with fog; (ii) acceleration by cycles wetting and drying, (iii) acceleration by electric current (electrochemical method): an intense electrical current is applied between the reinforcement (anode) and the counter electrode (cathode). The last method seems to be the one most often adopted to this study because it is the fastest method. The electrochemical corrosion technique was used to induce accelerated corrosion of the reinforcement bar embedded in the concrete. The steel bar acted as the anode as it was connected to the positive terminal of the external power supply, while a stainless steel plate was placed in the tank acted as the cathode. Reinforcement bar was protruded 40 mm from the bottom of the concrete specimens. The embedded length was set at 50 mm to ensure bond failure. To prevent contact between the concrete and the reinforcement bars while maintaining the required concrete cover on the surface of the concrete specimen, 50 mm lengths of the reinforcement bars were placed inside polyvinyl chloride (PVC) pipes The specimens were fully immersed in plastic tanks with an aqueous solution of 3.5% sodium chloride by weight for four days before being subjected to the accelerated corrosion procedure. After that the specimens were placed in the container which was specimens were placed in the container which was Before mixing the concrete, the reinforcement bars were carefully cleaned. The mass of the reinforcement filled with a 5% NaCl solution. The specimens were connected in parallel to a DC power supply of constant 60 V and the current passing through each specimen was daily recorded. Using Faraday’s Law, the corrosion of the bars was monitored (Stanish et al 9). Two specimens were not subjected to filled with a 5% NaCl solution. The specimens were connected in parallel to a DC power supply of constant 60 V and the current passing through each specimen was daily recorded. Using Faraday’s Law, the corrosion of the bars was monitored (Stanish et al 1999). Two specimens were not subjected to corrosion in order to serve as a control. corrosion in order to serve as a control. [5][6][7] recorded, and the bars were aligned and fastened to the moulds. A mould- releasing compound was applied to the inside surfaces of the specimen moulds. Compaction was performed with a table vibrator. After pouring and compacting en surface was smoothed with a steel trowel. The concrete specimens were kept in a curing room maintained at 22 °C (±2 °C) and 90% relative humidity for 24 h. Demoulding and transportation of the specimens were conducted with bance of the reinforcement bars. After demoulding, the specimens were cured in a water tank at 22 °C (±2 °C) for 28 Each rebar sample was weighed prior to casting using an analytical balance with precision of 0.01 g. After which they were subjected to accelerated corrosion test; whereas the concrete cubes were tested for compressive strength at the age of 28 days. The known methods to accelerate corrosion are the following: (i) acceleration by a cyclic test with fog; acceleration by cycles wetting and drying, (iii) acceleration by electric current (electrochemical method): an intense electrical current is applied between the reinforcement (anode) and the counter- electrode (cathode). The last method seems to be the most often adopted to this study because it is the Fig.1 Electrochemical corrosion technique set Fig.1 Electrochemical corrosion technique set-up The designed (theoretical) mass loss of the reinforcement bars due to corrosion was calculated according to Faraday's law: Mass Loss = ???? × ??????? ?×????? Where, t is the time (s), I is the current (A), 55.847 (g/mol) is the molar mass for iron and 96,487 (coulomb) is the Faraday's constant. The actual corrosion level or percentage specimen was calculated by Eq. (2): Corrosion Level, CL = ???? ?? ? × where, G0 is the initial weight of the reinforcement bar before corrosion, G is the final weight of the steel bar after removal of the corrosion , per unit length of the reinforcement bar and bond length. [5] D.Pull-out test A loading frame was designed and fabricated to perform the pulled tests, as shown in fig.3. The upper rod of the frame was fixed to the upper jaw of the machine to lift the weight of specimens. Two linear variable differential transformers (LVDTs) were variable differential transformers (LVDTs) were The designed (theoretical) mass loss of the reinforcement bars due to corrosion was calculated × ??.??? Eq. (1): ????? Where, t is the time (s), I is the current (A), 55.847 (g/mol) is the molar mass for iron and 96,487 (coulomb) is the Faraday's constant. The actual corrosion level or percentage mass loss of each The electrochemical corrosion technique was used to induce accelerated corrosion of the reinforcement bar embedded in the concrete. The steel bar acted as the the positive terminal of the external power supply, while a stainless steel plate was placed in the tank acted as the cathode. Reinforcement bar was protruded 40 mm from the × 100 % Eq. (2): The embedded ond failure. To is the initial weight of the reinforcement bar before corrosion, G is the final weight of the steel bar after removal of the corrosion , g0 is the weight per unit length of the reinforcement bar and l is the prevent contact between the concrete and the reinforcement bars while maintaining the required concrete cover on the surface of the concrete specimen, 50 mm lengths of the reinforcement bars were placed inside polyvinyl chloride (PVC) pipes. A loading frame was designed and fabricated to perform the pulled tests, as shown in fig.3. The upper rod of the frame was fixed to the upper jaw of the machine to lift the weight of specimens. Two linear The specimens were fully immersed in plastic tanks with an aqueous solution of 3.5% sodium chloride by weight for four days before being subjected to the After that the @ IJTSRD | Available Online @ www.ijtsrd.com www.ijtsrd.com | Volume – 3 | Issue – 1 | Nov-Dec 2018 Dec 2018 Page: 823
International Journal of Trend in Scientific Research and Development (IJTSRD) ISSN: 2456 International Journal of Trend in Scientific Research and Development (IJTSRD) ISSN: 2456 International Journal of Trend in Scientific Research and Development (IJTSRD) ISSN: 2456-6470 applied to monitor the free-end slip. The data from the LVDT was collected through the datalogger TC and the pullout load was collected by a computer. Load was applied at a rate of 4.4 kN per minute, up to failure. Pullout tests were performed for both corroded and uncorroded specimens based on ASTM C 234-91a.[15] The bond tests were performed with a Shimadzu universal testing machine with a capacity of 1000 kN. This apparatus was especially designed and adapted to avoid any changes in bond strength duri the pullout test. None of the reinforcement bars reached the yield point during the pullout tests, and the maximum pullout forces were recorded to calculate the ultimate bond strength (τ) according to Eq.(3): Measured bond strength , ? = where, F is the ultimate pullout load and the diameter and bond length of the reinforcement bars, respectively. end slip. The data from the remove the corrosion products with minimal remove the corrosion products with minimal dissolution of any base metal. base metal. LVDT was collected through the datalogger TC-32 K and the pullout load was collected by a computer. Load was applied at a rate of 4.4 kN per minute, up to failure. Pullout tests were performed for both corroded and uncorroded specimens based on ASTM 91a.[15] The bond tests were performed with a Shimadzu universal testing machine with a capacity of 1000 kN. This apparatus was especially designed and adapted to avoid any changes in bond strength during the pullout test. None of the reinforcement bars reached the yield point during the pullout tests, and the maximum pullout forces were recorded to calculate the ultimate bond strength (τ) according to ? ????? Eq. (3): where, F is the ultimate pullout load and db and le are the diameter and bond length of the reinforcement Fig.3 Cleaning and weighing of rebar Fig.3 Cleaning and weighing of rebar According to ASTM-G1-03, table (A 1.1). The solution contained 500ml hydrochloric acid ( g/m3) and 3.5g hexamethylenetetramine was freshly prepared with distilled water to make 1000ml. After cleaning, the metal specimen should be thoroughly rinsed, first with tap water and finally with distilled water. Then the specimen was dried in an oven and allowed to cool in a desiccator to the balanced room temperature before reweighing to the nearest 0.1mg. [16] III. Results and Discussions A.Material properties and mix proportions Properties of cement, sand and gravel were tested at Irrigation Technological Center in Bago. 1.Cement Ordinary portland cement (Double Rhinos) was used in this research. Specific gravity test, consistency test, setting time test and compressive strength of cement mortar test were carried out according to ASTM C 188[8], ASTM C 187[9], ASTM C 191[10] and ASTM C 109[11] respectively. ctively. 03, table (A 1.1). The solution contained 500ml hydrochloric acid ( = 1.18 ) and 3.5g hexamethylenetetramine was freshly prepared with distilled water to make 1000ml. After cleaning, the metal specimen should be thoroughly rinsed, first with tap water and finally with distilled water. Then the specimen was dried in an oven and lowed to cool in a desiccator to the balanced room temperature before reweighing to the nearest 0.1mg. Results and Discussions Material properties and mix proportions Properties of cement, sand and gravel were tested at er in Bago. cement (Double Rhinos) was used Fig.2 Pull-out test arrangement out test arrangement in this research. Specific gravity test, consistency test, setting time test and compressive strength of cement mortar test were carried out according to ASTM C 188[8], ASTM C 187[9], ASTM C 191[10] and E.Chemical cleaning procedure for removal of corrosion products Corrosion products on corroded specimens were removed by chemical procedure. Chemical procedures involve immersion of corroded test specimen in a chemical solution which is specially designed to chemical solution which is specially designed to Chemical cleaning procedure for removal of Corrosion products on corroded specimens were removed by chemical procedure. Chemical procedures involve immersion of corroded test specimen in a TABLE 1 Properties of Cement -tency (%) Setting Time (min) Compressive Strength (kg/cm Initial Final 29.88 1:55 3:50 30.38 1:55 3:55 30.38 1:45 3:55 1:51 3:53 Compressive Strength (kg/cm2) Test No. Specific gravity Consis- 3 Days 374.15 436.17 320.13 376.82 7 Days 448.18 488.2 390.16 442.18 1 2 3 3.13 3.15 3.14 3.14 29.88 30.38 30.38 30.21 30.21 Avg. @ IJTSRD | Available Online @ www.ijtsrd.com www.ijtsrd.com | Volume – 3 | Issue – 1 | Nov-Dec 2018 Dec 2018 Page: 824
International Journal of Trend in Scientific Research and Development (IJTSRD) ISSN: 2456 International Journal of Trend in Scientific Research and Development (IJTSRD) ISSN: 2456 International Journal of Trend in Scientific Research and Development (IJTSRD) ISSN: 2456-6470 TABLE 4 Water quality test results Water Tests pH 6 Total Alkalinity CaCO3 Chloride (as Cl-) Sulphate (as SO4-) Total Solids TABLE 4 Water quality test results 2.Fine aggregate In this study, sand from Pyinbongyi in Bago region was choosen as fine aggregate. The specific gravity, absorption percentage, finite modulus, unit weight and salt percent were done and the average values was shown in table 2. All values were allowable lim according to ASTM. And sieve analysis was done according to ASTM C 136[12] and the grading curve was constructed and this curve lies between upper and lower grading curves. TABLE 2 Physical properties of fine aggregate Physical properties of fine aggregate In this study, sand from Pyinbongyi in Bago region was choosen as fine aggregate. The specific gravity, absorption percentage, finite modulus, unit weight and salt percent were done and the average values was shown in table 2. All values were allowable limit according to ASTM. And sieve analysis was done according to ASTM C 136[12] and the grading curve was constructed and this curve lies between upper and Maximum Results Concentrations 6~8 6~8 Concentrations (mg/l) 67 mg/l as 600 600 149.17 mg/l 20,000~50,000 20,000~50,000 97 mg/l 10,000~40,000 10,000~40,000 598 mg/l 2,000 2,000 Unit Weight (gm/cc) 1.46 5.Concrete mix design In this research, 35 MPa compressive strength was chosen and some trial tests were done to get target strength of 43.3 MPa based on ACI 211 mix design method. Some trials were done and the optimal design was chosen to get the target strength. The final composition of concrete mixture is shown in table 4 and the concrete samples are shown in figure 2. TABLE 5 Composition of concrete ingredients and its compressive strength Test 1 w/c 0.42 Cement (kg/m3) 488.1 Water (kg/m3) 205 Fine aggregate (kg/m3) Coarse aggregate (kg/m3) Slump (mm) 80 7 days comp: (MPa) 28 days comp: (MPa) Absorption (%) Salt Content Sp.Gr F.M Weight (gm/cc) In this research, 35 MPa compressive strength was chosen and some trial tests were done to get target strength of 43.3 MPa based on ACI 211 mix design method. Some trials were done and the optimal design was chosen to get the target strength. The final mposition of concrete mixture is shown in table 4 and the concrete samples are shown in figure 2. 2.59 1.44 2.36 0.005 3.Coarse Aggregate River Shingle from North Dagon was used as coarse aggregate and its maximum size was 19 mm. The sieve analysis was done according to ASTM C 117 and the grading curve was constructed. grading curve of aggregate lies alittle above the stadard upper curve. The required properties were tested and the average properties of coarse aggregates are described in table 3. TABLE 3 Properties of Coarse aggregates Sp.Gr. River Shingle from North Dagon was used as coarse aggregate and its maximum size was 19 mm. The sieve analysis was done according to ASTM C 117 and the grading curve was constructed. [13] The grading curve of aggregate lies alittle above the stadard upper curve. The required properties were tested and the average properties of coarse aggregates TABLE 5 Composition of concrete ingredients and its compressive strength Test 2 0.42 488.1 488.1 488.1 205 205 Test 3 0.42 Test No. Avg. 0.42 Properties of Coarse aggregates 2.61 2.61 205 Absorp-tion (%) 0.7 0.7 440.3 440.3 440.3 440.3 F.M 6 6 1175 1175 1175 1175 Unit weight (gm/cc) 1.77 1.77 89 86 85 Abrasion (%) 33.2 33.2 40.99 38.37 40.55 39.97 A.M.F (%) 0.72 0.72 47.93 43.34 46.49 45.92 5 cycle soundness (%) 9.83 9.83 Flakiness index (%) 8.87 8.87 Elongation index (%) 14.72 14.72 4.Mixing water Mixing water for concrete was used from YTU campus. The following tests were performed to detect the impurities, sulfate and chloride in the mix water because these may affect setting time, drying shrinkage, or durability and ultimate strength. [4] Mixing water for concrete was used from YTU performed to detect the impurities, sulfate and chloride in the mix water because these may affect setting time, drying shrinkage, or durability and ultimate strength. [4] Fig.4 Concrete mix samples Fig.4 Concrete mix samples @ IJTSRD | Available Online @ www.ijtsrd.com www.ijtsrd.com | Volume – 2 | Issue – 6 | Sep-Oct 2018 Oct 2018 Page: 825
International Journal of Trend in Scientific Research and Development (IJTSRD) ISSN: 2456 International Journal of Trend in Scientific Research and Development (IJTSRD) ISSN: 2456 International Journal of Trend in Scientific Research and Development (IJTSRD) ISSN: 2456-6470 TABLE 8 Corrosion Level and Mass Loss Corrosion Level and Mass Loss 6.Reinforcing Steel Deformed steel bars 16 mm in diameter (HRB and 450 mm long were used for all specimens. Tensile tests were performed on three randomly selected reinforcement bars and tested at MES in accordance with a ASTM- A 615/A. The tested values are shown in table 6. [14] TABLE 6 Properties of reinforcement bars Nominal diameter of bar (mm) 1 16 592.3 2 16 603.5 3 16 614 Avg 16 603.3 B.Pull out Test Results The pull out test was done with Universal Testing Machine and the results are shown in Table 7. Most specimens occur split failure because grade 35 concrete is used in this study. TABLE 7 Experimental test results of pull Ultimate bond strength (MPa) S-16-1 36.19 14.4 S-16-2 40.66 16.18 S-16-3 65.62 26.11 S-16-4 61.51 24.47 S-16-5 31.16 12.4 S-16-6 16.54 6.58 S-16-7 23.71 9.43 S-16-8 41.46 16.5 S-16-9 67.69 26.93 S-16-10 17.97 7.15 S-16-11 26.93 10.72 S-16-12 47.32 18.83 S-16-13 65.88 26.21 S-16-14 71.94 28.62 S-16-15 65.23 25.95 S-16-16 66.07 26.09 S-16-17 70.53 28.06 S-16-18 78.87 31.38 S-16-19 62.93 25.04 S-16-20 70.21 27.93 S-16-21 73.76 29.35 Deformed steel bars 16 mm in diameter (HRB-400C) and 450 mm long were used for all specimens. Tensile tests were performed on three randomly selected reinforcement bars and tested at MES in accordance A 615/A. The tested values are shown Theo; Actual mass loss (g) 1.41 1.48 1.17 1.52 1.91 3.94 2.64 1.09 0 3.13 1.75 1.48 0.94 0.69 0.62 0.7 0.55 0.6 0 0.63 0.57 Specimen No. Corrosion Level (%) mass loss mass loss (g) 1.59 1.53 1.18 1.32 1.64 2.05 2.08 3.36 0 0.86 0.47 0.61 1.78 1.50 1.31 1.47 0.22 0.24 0 0.89 0.82 S-16-1 S-16-2 S-16-3 S-16-4 S-16-5 S-16-6 S-16-7 S-16-8 S-16-9 S-16-10 S-16-11 S-16-12 S-16-13 S-16-14 S-16-15 S-16-16 S-16-17 S-16-18 S-16-19 S-16-20 S-16-21 2.12 2.22 1.73 2.28 2.82 5.83 3.97 1.57 0 4.71 2.63 2.2 1.39 1.03 0.91 1.04 0.8 0.88 0 0.93 0.85 Properties of reinforcement bars Yield Strength (MPa) Ultimate Strength (MPa) (MPa) Ultimate Strength Sr No Elongat ion (%) 717 721.8 738.8 725.9 725.9 13.2 11.2 11.7 12.03 721.8 738.8 The pull out test was done with Universal Testing Machine and the results are shown in Table 7. Most specimens occur split failure because grade 35 Experimental test results of pull-out test Max. Force (kN) Max. Slip (mm) (mm) Max. Slip Failure mode Specimen No. TABLE 9 Decreased Bond Strength with Different Corrosion Levels Corrosion Level (%) 0.93 2.12 3.97 4.71 5.83 Decreased Bond Strength with Different Corrosion Levels Decreased Bond Decreased Bond Strength (%) Strength (%) -3.72 47 65 73 75 0.36 0.27 0.31 0.41 0.28 0.45 0.20 0.03 0.13 0.22 0.33 0.25 0.12 0.58 0.50 0.45 0.74 1.99 2.09 0.56 0.9 0.9 0.36 0.27 0.31 0.41 0.28 0.45 0.20 0.03 0.13 0.22 0.33 0.25 0.12 0.58 0.50 0.45 0.74 1.99 2.09 0.56 Split Split Split Split Split Split Split Split Split Split Split Split Split Split Split Split Split Pull-out Pull-out Split Pull-out The decreased bond strength is calculated based on zero percentage corrosion level. When corrosion increased to about 1%, the bond strength increased to about 4% and when corrosion increased to 5.83%, the bond strength decreased to about the bond strength decreased gradually when the corrosion level is higher. C.Influence of corrosion levels on the bond strength For low levels of corrosion, the bond strength increased due to the increased roughness of the steel bar caused by the confined corrosion products and then decreased for a given corrosion level. then decreased for a given corrosion level. The decreased bond strength is calculated based on zero percentage corrosion level. When corrosion increased to about 1%, the bond strength increased to about 4% and when corrosion increased to 5.83%, the bond strength decreased to about 75%. It is found that the bond strength decreased gradually when the Influence of corrosion levels on the bond For low levels of corrosion, the bond strength increased due to the increased roughness of the steel caused by the confined corrosion products and @ IJTSRD | Available Online @ www.ijtsrd.com www.ijtsrd.com | Volume – 3 | Issue – 1 | Nov-Dec 2018 Dec 2018 Page: 826
International Journal of Trend in Scientific Research and Development (IJTSRD) ISSN: 2456 International Journal of Trend in Scientific Research and Development (IJTSRD) ISSN: 2456 International Journal of Trend in Scientific Research and Development (IJTSRD) ISSN: 2456-6470 IV. In this study grade 35 concrete with HRB mm rebar is used to study corrosion effect on bond strength. The electrochemical corrosion technique is applied to obtain the corroded rebar. Most corroded specimens failed by splitting the concrete as grade 35 concrete is more brittle than the low strength concrete. When the corrosion level is increased and the bond strength is decreased and slip is increased. According to test results, when the corrosion is started, the bond strength increased due to the increased roughness of the steel bar caused by the confined corrosion products. However the corrosion level is increased about 5%, the bond strength decreases 75%. The maximum mass losses between actual and theory is about 2g for bonded length 50 mm. Based on the experimental result of the study, reinforcement corrosion levels have significant effects on bond performance of reinforcing bars in concrete. ACKNOWLEDGMENT The author would also like to extend much thanks to the head and technicians of the laboratory of Department of Engineering Chemistry, Y.T.U for their helps in removal of corrosion products. The author wishes to acknowledge Myanmar Engineering Society for their help in tensile test of the rebar and Irrigation Technology Center in Bago region for their kindness in testing the properties of the materials used in concrete mixture. REFERENCES 1.Neville, A.M. 2011. Properties of Concrete, ed. Pitman Publishing Limited, Landon. ng Limited, Landon. CONCLUSIONS In this study grade 35 concrete with HRB-400C 16 mm rebar is used to study corrosion effect on bond strength. The electrochemical corrosion technique is applied to obtain the corroded rebar. Most corroded 35 30 Bond Strength (MPa) 25 20 15 the concrete as grade 35 concrete is more brittle than the low strength concrete. When the corrosion level is increased and the bond strength is decreased and slip is increased. According to test results, when the corrosion is started, the bond creased due to the increased roughness of the steel bar caused by the confined corrosion products. However the corrosion level is increased about 5%, the bond strength decreases 75%. The maximum mass losses between actual and theory is length 50 mm. Based on the experimental result of the study,it was found that reinforcement corrosion levels have significant effects on bond performance of reinforcing bars in concrete. 10 5 0 0 2 4 6 Corrosion Level (%) Fig.5 Bond strength versus achieved corrosion level Fig.5 Bond strength versus achieved corrosion level D.Influence of corrosion levels on slip The slip of the control specimens was higher than that of the corroded specimens. The slip corresponding to the maximum bond strength decreased with an increasing corrosion level considered. Influence of corrosion levels on slip The slip of the control specimens was higher than that pecimens. The slip corresponding to the maximum bond strength decreased with an increasing corrosion level within within the the range range 2.5 Maximum Slip (mm) The author would also like to extend much thanks to the head and technicians of the laboratory of Department of Engineering Chemistry, Y.T.U for their helps in removal of corrosion products. The author wishes to acknowledge Myanmar Engineering their help in tensile test of the rebar and Irrigation Technology Center in Bago region for their kindness in testing the properties of the materials used 2 1.5 1 0.5 0 0 1 2 Corrosion Level (%) 3 4 5 5 6 Fig.6 Slip at bond strength versus achieved corrosion level E.Slip properties with corrosion of the rebar The values of load-slip show higher trends for control specimens than other specimens with different corrosion levels. The more corroded the specimen is, the lower the trend is except for a very small amount corrosion. 90 Fig.6 Slip at bond strength versus achieved corrosion Properties of Concrete, 5th Slip properties with corrosion of the rebar slip show higher trends for control specimens than other specimens with different corrosion levels. The more corroded the specimen is, the lower the trend is except for a very small amount 2.Neville, A. M, and Books, J. J. 1994 Technology, England: Longman Group UK Limited. Neville, A. M, and Books, J. J. 1994 Concrete , England: Longman Group UK 3.American Concrete Institute Committee, 1-91: Standard Practice for Selecting Proportions for Normal, Heavyweight, and Mass Concrete,. American Concrete Institute American Concrete Institute. American Concrete Institute Committee, ACI 211. Standard Practice for Selecting Proportions for Normal, Heavyweight, and Mass Concrete,. 80 70 4.Aye Aye Thaw. 2017. Study on Performance of Cassava Flour as a Set Concrete Production, M.E. Thesis, Yangon Technological University. 60 Study on Performance of Load (kN) Cassava Flour as a Set-Retarding Agent for , M.E. Thesis, Yangon 50 40 30 20 5.Adel A. Elbusaefi, The Effect of Steel Bar Corrosion on the Bond Strength Manufactured with Materials, Ph. D 2014. The Effect of Steel Bar 10 Corrosion on the Bond Strength of Concrete Manufactured with Cement Cement Replacement Replacement 0 0 0.5 1 1.5 2 Slip (mm) with different corrosion level Fig.7 Load – slip curves with different corrosio @ IJTSRD | Available Online @ www.ijtsrd.com www.ijtsrd.com | Volume – 3 | Issue – 1 | Nov-Dec 2018 Dec 2018 Page: 827
International Journal of Trend in Scientific Research and Development (IJTSRD) ISSN: 2456 International Journal of Trend in Scientific Research and Development (IJTSRD) ISSN: 2456 International Journal of Trend in Scientific Research and Development (IJTSRD) ISSN: 2456-6470 6.Hakan Yalciner, Ozgur Eren, Serhan Sensoy. Experimental study on the bond strength between reinforcement bars and concrete as a function of concrete cover, strength and corrosion l concrete cover, strength and corrosion level. Hakan Yalciner, Ozgur Eren, Serhan Sensoy. An Experimental study on the bond strength between reinforcement bars and concrete as a function of Mortars Specimens). (Using 2-in. in. or or [50 [50-mm] Cube 12.ASTM C 136 - 96. Standard Test Method for Sieve Analysis of Fine and Coarse Aggregates. Sieve Analysis of Fine and Coarse Aggregates. Standard Test Method for 7.Nabeel Shaikh, Sheetal Sahare. Impressed Current on corrosion of Reinforcing Bar in Reinforced Concrete. Nabeel Shaikh, Sheetal Sahare. Effect of Impressed Current on corrosion of Reinforcing 13.ASTM C 117-95. Standard Test Method for Materials Finer than 75- Mineral Aggregates by Washing. Mineral Aggregates by Washing. Standard Test Method for -μm (No. 200) Sieve in 8.ASTM C 188- 95. Standard Test Method for Density of Hydraulic Cement. Standard Test Method for 14.ASTM A 615/A. Standard Specification for Deformed and Plain Carbon Steel Bars for Concrete Reinforcement. Standard Specification for nd Plain Carbon Steel Bars for 9.ASTM C 187 – 98. Standard Test Method for Normal Consistency of Hydraulic Cement. Standard Test Method for ydraulic Cement. 15.ASTM C 234 – 91 a, Bond Strength of Concrete Developed with Reinforcing Steel . Developed with Reinforcing Steel . Bond Strength of Concrete 10.ASTM C 191 – 04. Standard Test Method for Time of Setting of Hydraulic Cement by Vicat Needle. Standard Test Method for Time of Setting of Hydraulic Cement by Vicat 16.ASTM G 1 – 03. Standard Practice for Preparing, Cleaning, and Evaluating Specimens. Standard Practice for Preparing, Evaluating Cleaning, and Corrosion Corrosion Test Test 11.ASTM C 109 –99. Standard Test Method for Compressive Strength of Hydraulic Cement Standard Test Method for Compressive Strength of Hydraulic Cement @ IJTSRD | Available Online @ www.ijtsrd.com www.ijtsrd.com | Volume – 3 | Issue – 1 | Nov-Dec 2018 Dec 2018 Page: 828