Download
1 / 20
200 likes | 218 Vues
Geochemical study of some stream sediments in Ijero Ekiti was carried out to deduce their provenance, paleo redox environment and source area weathering. The SiO2 Al2O3 K2O Na2O ratios for the paleoclimate during deposition indicates the arid semi arid conditions. This moderate climate will give rise to moderate weathering process. The weathering indices CIA, CIW, PIA and MIA and the ACNK Ternary diagram indicate a moderate degree of weathering of the source materials. The average Th U ratio of the stream sediments is 1.66, which also suggests moderate degree of weathering of the source material. The stream sediments were enriched in both TiO2 and Zr, which implies that the stream sediments may have originated from a felsic source. The bivariate plot of Na2O K2O shows that all the samples are quartz rich, which suggests that they may be of felsic origin. The provenance discriminant function plot shows the samples plotted mainly in the felsic igneous and quartzose sedimentary zones. The TiO2 versus Zr plot shows all the stream sediments plotting in felsic zone average Cr V ratio for sediments is 1.49, while the Y Ni ratio is 0.98 suggesting a felsic source. Bivariate plots Ti versus Ni and K versus Rb revealed that the samples are of acidic felsic intermediate composition. The ternary plot of La Th Sc of the analyzed samples suggest derivation from felsic rocks of granite and granodiorite composition. However, In the ternary diagram of V Ni Th 10, all the samples plotted in the mafic source area. Element ratios such as U Th, Ni Co, Cu Zn, Cu Mo Zn, V Cr and V Sc indicate that the stream sediments were deposited under oxic conditions. V Ni V ratios indicate suboxic to anoxic environment of deposition while the Mn values suggests oxic and suboxic environment. Henry Y. Madukwe "Source-Area Weathering, Composition and Paleo-Redox Condition of Stream Sediments from Ijero-Ekiti, Nigeria" Published in International Journal of Trend in Scientific Research and Development (ijtsrd), ISSN: 2456-6470, Volume-1 | Issue-5 , August 2017, URL: https://www.ijtsrd.com/papers/ijtsrd2365.pdf Paper URL: http://www.ijtsrd.com/other-scientific-research-area/geology/2365/source-area-weathering-composition-and-paleo-redox-condition-of-stream-sediments-from-ijero-ekiti-nigeria/henry-y-madukwe<br>

E N D
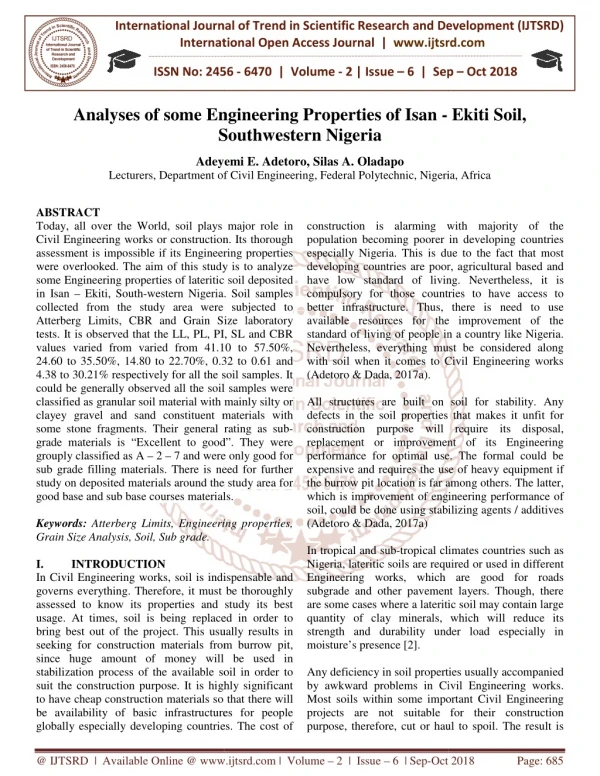
International Journal of Trend in Scientific Research and Development (IJTSRD) International Open Access Journal ISSN No: 2456 - 6470 | www.ijtsrd.com | Volume - 1 | Issue – 5 Source-Area Weathering, Composition and Paleo-Redox Condition of Stream Sediments from Ijero-Ekiti, Nigeria Henry Y. Madukwe Department of Geology, Ekiti State University, Ado-Ekiti, Ekiti State, Nigeria ABSTRACT Ni/Co, Cu/Zn, (Cu+Mo)/Zn, V/Cr and V/Sc indicate that the stream sediments were deposited under oxic conditions. V/(Ni+V) ratios indicate suboxic to anoxic environment of deposition while the Mn* values suggests oxic and suboxic environment. Keywords: weathering, paleoclimate, provenance, felsic, tectonic setting INTRODUCTION Major elements and selected trace and rare earth elements and their elemental ratios are sensitive indicators of the source rocks, tectonic setting, paleoweathering conditions and paleoclimate of the clastic sediments (Bhatia, 1983; Bhatia and Crook, 1986; Roser and Korsch, 1986; Roser and Korsch, 1988; McLennan and Taylor, 1991; McLennan et al., 1993; Johnsson and Basu, 1993; Condie, 1993; Nesbitt et al., 1996; Fedo, et al., 1997; Cullers and Podkovyrov, 2000; Bhatt and Ghosh, 2001). The geochemical compositions of stream sediments reflect the average composition of an entire drainage basin (Halamic et al., 2001; Reimann and Melezhik, 2001). According to Grunsky geochemical studies based on the chemical analysis of active stream sediments are an effective tool with several applications. Several authors have used major element discrimination diagrams (Bhatia, 1983) to discriminate the tectonic settings of sedimentary basins and have been applied in topical publications Geochemical study of some stream sediments in Ijero- Ekiti was carried out to deduce their provenance, paleo-redox environment and source-area weathering. The SiO2/(Al2O3+K2O+Na2O) paleoclimate during deposition arid/semi-arid conditions. This moderate climate will give rise to moderate weathering process. The weathering indices (CIA, CIW, PIA and MIA) and the A–CN–K Ternary diagram indicate a moderate degree of weathering of the source materials. The average Th/U ratio of the stream sediments is 1.66, which also suggests moderate degree of weathering of the source material. The stream sediments were enriched in both TiO2 and Zr, which implies that the stream sediments may have originated from a felsic source. The bivariate plot of Na2O-K2O shows that all the samples are quartz-rich, which suggests that they may be of felsic origin. The provenance discriminant function plot shows the samples plotted mainly in the felsic igneous and quartzose sedimentary zones. The TiO2 versus Zr plot shows all the stream sediments plotting in felsic zone; average Cr/V ratio for sediments is 1.49, while the Y/Ni ratio is 0.98; suggesting a felsic source. Bivariate plots Ti versus Ni and K versus Rb revealed that the samples are of acidic/felsic intermediate composition. The ternary plot of La-Th-Sc of the analyzed samples suggest derivation from felsic rocks of granite and granodiorite composition. However, In the ternary diagram of V-Ni-Th*10, all the samples plotted in the mafic source area. Element ratios such as U/Th, ratios indicates for the the and Sutphin (2009), @ IJTSRD | Available Online @ www.ijtsrd.com | Volume – 1 | Issue – 5 | July-Aug 2017 Page: 746
International Journal of Trend in Scientific Research and Development (IJTSRD) ISSN: 2456-6470 (Kroonenberg, 1994; Zimmermann and Bahlburg, 2003; Armstrong-Altrin et al., 2004). According to Armstrong-Altrin and Verma (2005), caution is required in their uncritical use. The most important clues for the tectonic setting of the basin comes from the relative depletion of the most mobile elements like Ca and Na and enrichment of Si and Ti—the most immobile elements, among others. The oxides of these elements are assumed to show enrichment or depletion in quartz, K-feldspar, plagioclase feldspars, and micas. The ratio of the most immobile elements to the most mobile ones increases toward passive margins due to the relative tectonic stability (Bhatia, 1983; Kroonenberg, 1994; Bahlburg, 2003; Armstrong-Altrin et al., 2004; Roser and Korsch, 1986) and hence prolonged weathering. This can be recorded in sediments as paleoclimate index (Chittleborough, 1991; Harnois, 1988; Nesbitt and Young, 1982) and high degree of sediment recycling. The study area lies between longitudes 5o 001 E and 5o 071 E, and latitudes 7o 461 N and 7o 531 N within the crystalline Basement Complex of south western Nigeria (Fig.1), and it is part of the schist belt. The local geology consists of the migmatite gneiss, quartzite, schist biotite gneiss, calc-gneiss, epidiorite, biotite schist, amphibole schist, granite and pegmatite (Fig. 2). Figure 3 shows the Ijero area and the sampling points. Zimmermann and Figure 1: Geological map of Nigeria showing the Basement Complex and other geological units, after Obaje (2011). @ IJTSRD | Available Online @ www.ijtsrd.com | Volume – 1 | Issue – 5 | July-Aug 2017 Page: 747
International Journal of Trend in Scientific Research and Development (IJTSRD) ISSN: 2456-6470 Figure 2: Geological map of Ijero Ekiti area (After Okunlola and Akinola, 2010) Figure 3: The study area showing the sample points The migmatite gneiss occurs within the eastern part covering about two-fifth of the area, biotite gneiss predominantly covers the northwest (the gneissic rocks are essentially highly foliated and denuded); @ IJTSRD | Available Online @ www.ijtsrd.com | Volume – 1 | Issue – 5 | July-Aug 2017 Page: 748
International Journal of Trend in Scientific Research and Development (IJTSRD) ISSN: 2456-6470 ➢0.2 g of NaCO3 was added to the mix and the sample+flux+NaCO3 was pre-oxidized oat 700 °C before fusion. ➢Flux type: Ultrapure Fused Anhydrous Li- Tetraborate-Li-Metaborate flux (66.67 % Li2B4O7 + 32.83 % LiBO2) and a releasing agent Li-Iodide (0.5 % LiI). calc-gneiss and quartzite occupy a narrow NE-SW strip around Ijero-Ekiti town (Okunlola and Akinola, 2010). Epidiorite occurs as the major ultramafic assemblage while amphibole schist and biotite schist occupy the central, low-lying area that is occasionally pulsed with granites and pegmatite intrusions now exposed due to prolonged weathering activities. The pegmatite occurs as very coarse grained dykes, dykelets and sometimes of extensive dimension (Okunlola and Akinola, 2010). Steeply dipping complex pegmatite around Ijero-Ekiti typically consists of an outer medium-grained microcline-albite-quartz-muscovite intermediate zone comprising microcline-albite-quartz, blocky microcline-quartz, coarse-grained quartz or lepidolite-quartz and finally, a core of coarse-grained muscovite-quartz and quartz (Okunlola, 2005). Several workers have worked on the geology, tectonics, etc., of the Nigerian Precambrian Basement complex (e.g. Burke and Dewey, 1972; Oyawoye, 1972; Rahaman, 1976; Rahaman, and Ocan, 1978; Black, 1980; Turner, 1983; Ajibade et al, 1988; Rahaman, 1988). MATERIALS AND METHODS Several samples were initially obtained while ten which were representative of the stream channels were eventually selected and analyzed. Sediment samples were taken at a depth of 20-25cm; they were bagged and labeled to avoid mix up. The geographical locations of each sample collected were noted and recorded in the field notebook. The samples were air- dried, pulverized, homogenized, packaged and sent to the laboratory of Stellenbosch University, South Africa for geochemical analysis (major, trace and rare earth elements) using X-Ray Fluorescence (XRF) and Laser Ablation Inductively Coupled Plasma Mass Spectrometry (LA-ICP-MS). Pulverised sandstone samples were analysed for major element using Axios instrument (PANalytical) with a 2.4 kWatt Rh X-ray Tube. The detailed procedures for sample preparation for the analytical technique are reported below. Fusion bead method for major element analysis: ➢Weigh 1.0000 g ± 0.0009 g of milled sample ➢Place in oven at 110 ºC for 1 hour to determine H2O+ ➢Place in oven at 1000 ºC for 1 hour to determine LOI ➢Add 10.0000 g ± 0.0009 g Claisse flux and fuse in M4 Claisse fluxer for 23 minutes. The result returned eleven major elements, reported as oxide percent by weight (SiO2, TiO2, Al2O3, Fe2O3, MgO, MnO, CaO, Na2O, K2O, SO3 and P2O5). Loss on Ignition (LOI) is a test used in XRF major element analysis which consists of strongly heating a sample of the material at a specified temperature, allowing volatile substances to escape or oxygen is added, until its mass ceases to change. The LOI is made of contributions from the volatile compounds of H2O+, OH-, CO2, F-, Cl-, S; in parts also K+ and Na+ (if heated for too long); or alternatively added compounds O2 (oxidation, e.g. FeO to Fe2O3), later CO2 (CaO to CaCO3). In pyro-processing and the mineral industries such as lime, calcined bauxite, refractories or cement manufacturing industry, the loss on ignition of the raw material is roughly equivalent to the loss in mass that it will undergo in a kiln, furnace or smelter. The trace and rare elemental data for this work was acquired using Laser Ablation inductively coupled plasma spectrometry (LA-ICP- MS) analyses. The analytical procedures are as follows: Pulverised sandstone samples were analysed for trace element using LA-ICP-MS instrumental analysis. LA-ICP-MS is a powerful and sensitive analytical technique for multi elemental analysis. The laser was used to vaporize the surface of the solid sample, while the vapour, and any particles, were then transported by the carrier gas flow to the ICP-MS. The detailed procedures for sample preparation for both analytical techniques are reported below. Pressed pellet method for Trace element analysis: ➢Weigh 8 g ± 0.05 g of milled powder ➢Mix thoroughly with 3 drops of Mowiol wax binder ➢Press pellet with pill press to 15 ton pressure ➢Dry in oven at 100 ºC for half an hour before analysing. zone, coarse-grained an 10 samples each were sent to University of Ibadan and the Federal Polytechnic Ado-Ekiti, Nigeria for mineralogical and petrographic and granulometric analysis respectively. @ IJTSRD | Available Online @ www.ijtsrd.com | Volume – 1 | Issue – 5 | July-Aug 2017 Page: 749
International Journal of Trend in Scientific Research and Development (IJTSRD) ISSN: 2456-6470 RESULTS AND DISCUSSION Correction for CaO from carbonate contribution was not done for the studied sandstone samples since there was no CO2 data. Consequently, to compute for CaO* from the silicate fraction, the assumption proposed by Bock et al. (1998) was adopted. In this regard, CaO values were accepted only if CaO ≤ Na2O; accordingly, when CaO>Na2O, it was assumed that the concentration of CaO equals that of Na2O (Bock et al., 1998). This procedure provides measure of the ratio of the secondary aluminous mineral to feldspar, and forms a basis for the measure of intensity of weathering (Elzien et al., 2014). The Chemical Index of Weathering (CIW) proposed by Harnois, (1988) is similar to the CIA except for the exclusion of K2O in the equation: CIW = molar (Al2O3/(Al2O3+ CaO + Na2O)). The CIA and CIW are interpreted in similar way with values of 50 for unweathered upper continental crust and roughly 100 for highly weathered materials, with complete removal of alkali and alkaline-earth elements (McLennan et al., 1983; McLennan, 1993; Mongelli et al., 1996). Low CIA values (i.e. 50 or less) also might reflect cool and / or arid conditions (Fedo et al., 1995). The intensity of the chemical weathering can also be estimated using the Plagioclase Index of Alteration (Fedo et al., 1995); in molecular proportions: PIA = [(Al2O3-K2O)/ (Al2O3 + CaO* + Na2O-K2O)] × 100 where Source-Area Weathering The chemical component of the samples studied is shown in Table 1 while Table 2 shows some ratios and weathering indices of the studied samples. Weathering indices are useful to measure the degree of weathering of the terrestrial rocks from which sediment grains are derived. Chemical weathering indices are commonly used in recent and old weathering profile studies (Kirschbaum et al., 2005; Goldberg and Humayun, 2010). Previous work on clastic sedimentary rocks shows that their chemical composition is mainly dependent on the composition and the weathering conditions at the source rock area (Nesbitt and Young, 1989; Nesbitt et al., 1996). Nesbitt and Young (1982) was of the opinion that evaluation of the weathering/alteration of the sediments’ source rocks can be determined by calculating the Chemical Index of Alteration (CIA), (Al2O3/[Al2O3+CaO+Na2O+K2O]). This index works correctly when Ca, Na, and K decrease as the intensity of weathering increases (Duzgoren-Aydin et al., 2002). In the equation given above, CaO* is the amount of CaO incorporated in the silicate fraction of the studied sandstone samples (Fedo et al., 1995). degree of chemical where CIA = molar Table 1: Major, trace and rare element components of the samples, Oxides SiO2 Al203 Fe2O3 CaO MgO MnO K2O Na2O P2O5 TiO2 Cr2O3 AG-1 AG-2 AG-3 AG-4 AG-5 AG-6 AG-7 AG-8 AG-9 AG-10 64.06 15.91 61.05 15.91 68.16 15.28 67.41 15.88 70.17 15.76 67.21 17.11 61.39 16.09 73.13 12.6 61.11 19.57 77.9 9.72 4.41 6.52 3.16 2.95 1.89 2.21 6.12 3.76 6.27 2.54 1.23 1.09 0.53 0.57 0.43 0.43 0.68 0.51 0.16 0.13 1.81 2.27 0.9 0.75 0.49 0.5 1.7 0.53 0.37 0.31 0.09 0.1 0.05 0.04 0.03 0.04 0.27 0.14 0.04 0.05 2.77 2.27 2.68 1.33 3.41 1.86 3.83 1.91 4.34 2.23 4.17 1.88 4.4 2.05 3.64 1.46 2.48 0.98 2.33 0.86 0.18 0.15 0.16 0.14 0.15 0.14 0.16 0.15 0.11 0.1 1.41 1.7 1.04 0.94 0.71 0.94 0.55 1.28 1.4 1.86 0.01 0.01 0.01 0.01 0.01 0.01 0.01 0.01 0.01 0.01 Trace and Rare Earth Elements V Cr Co Ni Cu Zn 85.54 151.38 112.76 211.07 68.83 86.39 69.07 84.29 46.87 54.21 56.93 67.57 62.47 244.49 61.52 58.37 115.41 79.47 53.16 45.84 16.56 24.74 10.38 12.34 6.91 9.26 24.05 9.43 9.05 5.02 60.39 85.44 33.96 31.94 18.74 24.6 56.34 18.77 29.31 13.72 22.06 24.86 16.28 13.73 8.04 18.43 15.9 19.93 32.5 15.54 146.7 107.94 128.61 94.81 76.3 116.2 113.76 206.61 171.71 242.64 @ IJTSRD | Available Online @ www.ijtsrd.com | Volume – 1 | Issue – 5 | July-Aug 2017 Page: 750
International Journal of Trend in Scientific Research and Development (IJTSRD) ISSN: 2456-6470 Rb Sr Zr Nb Mo Cs Ba Hf Ta Pb Th U La Ce Pr Nd Sm Eu 317.34 145.58 292.35 117.11 363.46 67.16 363.75 101.1 449.51 74.88 406.48 72.55 323.89 181.55 253.69 119.72 330.87 36.06 220.87 27.41 468.62 524.06 341.4 386.98 436 440.37 170.08 565.6 407.85 580.99 204.05 112.54 114.32 226.24 132.57 188.13 108.09 292.49 127.68 214.27 0.77 0.63 0.66 0.59 0.5 0.77 0.75 0.77 1.56 0.52 12.85 14.83 17.18 11.42 10.25 11.7 16.05 7.89 18.03 9.15 317.77 14.84 343.6 14.82 311.66 10.3 361.12 10.81 281.17 12.83 272.79 12.86 750.85 5.04 368.04 20.64 274.87 11.87 210.53 15.99 125.97 32.55 32.7 77.79 45.57 48.67 16.49 49.55 32.97 43.95 20.22 21.13 26.16 26.99 21.7 25.54 31.53 31.19 22.53 16.61 13.69 13.01 7.18 7.86 11.01 11.2 6.68 46.18 12.82 16.35 8.03 6.76 7.39 6.64 6.24 11.85 8.52 18.89 9.52 4.7 47.12 53.96 27.82 33.92 40.42 32.97 23.94 82.28 35.18 47.05 102.19 11.36 113.75 12.55 58.73 6.49 72.96 7.41 80.66 9.25 72.52 7.71 51.68 5.17 175.42 19.69 63.82 7.45 97.55 11.35 42.33 46.32 23.91 26.95 34.41 28.34 19.69 72.53 28.44 42.97 9.57 9.49 4.95 5.02 7.1 6.37 3.62 16.1 5.85 8.04 1.28 1.68 0.83 1.03 1.07 0.94 0.85 1.04 0.92 1.04 Gd 7.31 7.86 4.4 3.91 5.94 5.63 3.25 12.07 5.17 6.47 Tb 1.05 1.1 0.76 0.62 1.05 0.95 0.42 1.93 0.97 0.93 Dy 5.09 6.1 4.37 3.78 6.6 5.06 2.55 7.72 5.91 5.66 Ho 0.84 1.08 0.89 0.77 1.15 0.87 0.46 0.98 1.05 1.1 Er 2.27 3.39 2.56 2.01 3.03 2.55 1.2 1.99 3 3.02 Tm 0.32 0.41 0.35 0.31 0.39 0.36 0.17 0.29 0.42 0.41 Yb 2.03 2.89 2.53 2.2 2.74 2.62 1.11 2.04 3.14 3.03 Lu 0.32 0.45 0.36 0.3 0.47 0.38 0.16 0.31 0.42 0.43 Sc 12.42 16.23 10.72 9.42 8.15 9.31 8.69 8.39 14.27 8.07 Y 24.09 30.19 24.27 20.84 32.34 26.09 11.87 29.17 30.42 28.94 Table 2: Some ratios and weathering indices of the studied samples AG-1 AG-2 AG-3 AG-4 AG-5 AG-6 AG-7 AG-8 AG-9 AG-10 PIA 79 85 83 83 81 85 81 82 94 88 CIA 71.73 75.73 72.49 71.56 69.24 72.53 69.29 69.19 84.39 74.54 CIW 81.97 86.80 86.47 86.49 85.56 88.11 85.49 86.48 94.50 90.76 MIA 43.46 51.45 44.97 43.13 38.49 45.06 38.59 38.39 68.78 49.08 SiO2/Al2O3 4.03 3.84 4.46 4.24 4.45 3.93 3.82 5.80 3.12 8.01 Log(K2O/Na2O) Cr/Ni 0.09 0.30 0.26 0.30 0.29 0.35 0.33 0.40 0.40 0.43 2.51 2.47 2.54 2.64 2.89 2.75 4.34 3.11 2.71 3.34 Cr/V 1.77 1.87 1.26 1.22 1.16 1.19 3.91 0.95 0.69 0.86 Y/Ni 0.40 0.35 0.71 0.65 1.73 1.06 0.21 1.55 1.04 2.11 Co/Th 1.21 1.90 1.45 1.57 0.63 0.83 3.60 0.20 0.71 0.31 Th/U 1.71 1.93 0.97 1.18 1.77 0.95 0.78 2.45 1.35 3.48 @ IJTSRD | Available Online @ www.ijtsrd.com | Volume – 1 | Issue – 5 | July-Aug 2017 Page: 751
International Journal of Trend in Scientific Research and Development (IJTSRD) ISSN: 2456-6470 Th.Sc Zr/Sc 1.10 37.73 0.80 32.30 0.67 31.86 0.83 41.10 1.35 53.53 1.20 47.30 0.77 19.58 5.51 67.45 0.90 28.59 2.03 72.04 Chemical index of alteration (CIA, Nesbitt and Young, 1982), Chemical Index of Weathering (CIW, Harnois, 1988), Plagioclase Index of Alteration (PIA, Fedo et al., 1995), Mineralogical index of alteration (MIA, Voicu et al., 1997). CaO* is the CaO residing only in the silicate fraction. Unweathered plagioclase has PIA value of 50. CIA values for the stream sediments ranged between 69.2 and 84.4% (moderate to intense) with an average of 73.1% (moderate), indicating moderate to intense degree of weathering of the source materials. The CIW for ranged between 82 and 94.5% (Average = 87.3%), indicating intense degree of weathering of the source materials. The PIA values ranged from 79-94% (Average = 84%) indicating intense degree of weathering. The Mineralogical Index of Alteration (MIA) proposed by Voicu et al. (1997) is another weathering parameter calculated as: MIA = 2*(CIA- 50). MIA values between 0 and 20% are designated as incipient, i.e. just starting; 20-40% (weak); 40-60% (moderate) and 60-100% as intense to extreme degree of weathering. The extreme value of 100% indicates complete weathering of a primary material into its equivalent weathered. MIA values is between 38.4 and 69% (Average = 46.14%), which indicates moderate weathering condition of the source material. Figure 4 shows the samples plotting close to the average shale area; this suggests moderate degree of weathering. Th/U ratio can be used to decipher the weathering history due to the oxidation and loss of uranium during the weathering process. All the stream sediments showed a trend below the upper crust value (fig. 5). The overall scenario suggests that weathering conditions were moderate and constant during sedimentation. McLennan et al. (1995) suggested that a ratio near 3.8 indicates a relatively unweathered source; the average Th/U ratio of the stream sediments is 1.66, which suggests moderate degree of weathering of the source material. According to Pe- Piper et al. (2008), the precise value will vary according to local hinterland geology. Source composition Inorganic geochemical data and their applications are important for provenance studies (e.g. Taylor and McLennan, 1985; Condie et al., 1992; Cullers, 1995; Armstrong-Altrin et al., 2004). According to McLennan et al., (1993), major elements provide information on both the rock composition of the provenance and the effects of sedimentary processes, such as weathering and sorting. These elucidates on the attributes of the source rocks and providing definite patterns of sedimentary history (Dickinson, 1985, 1988). The bivariate plot of Na2O-K2O shows that all the samples are quartz-rich, which suggests that they may be of felsic origin (Fig. 6). The ternary diagram in figure 7 shows most of the samples plotting around the granite area, this suggests derivation from felsic igneous source. A Kaolinite, Gibbsite, Chlorite Smectite Illite Average shale Muscovite Felsic Plagioclase K-feldspar Mafic Typical igneous composition Upper Continental Crust K CN Figure weathering trend of the studied samples (all in molar proportions); Al2O3–CaO +Na2O−K2O (A– CN–K). Fields from Gu et al. (2002) . 4: Ternary diagram showing the @ IJTSRD | Available Online @ www.ijtsrd.com | Volume – 1 | Issue – 5 | July-Aug 2017 Page: 752
International Journal of Trend in Scientific Research and Development (IJTSRD) ISSN: 2456-6470 Figure 7: Plot of Na2O + K2O, SiO2/10 and CaO + MgO to illustrate possible affinities of the samples to felsic, mafic or ultramafic rocks (after Taylor and McLennan, 1985) The provenance discriminant function plot of Roser and Korsch (1988) defined provenances: mafic igneous provenance; intermediate igneous provenance; felsic igneous provenance; and quartzose sedimentary provenance (Fig. 8). The samples plotted mainly in the felsic igneous and quartzose sedimentary zones. According to Roser (2000), sediments recycled from felsic sources plot progressively away from the igneous source line into the quartzose field. The concentration of zircon is used to characterize the nature and composition of source rock (Hayashi et al., 1997; Paikaray et al., 2008). Hayashi, et al. (1997) stated that the TiO2/Zr ratios are so much supportive to distinguish among three different source rock types, i.e., felsic, intermediate and mafic. The TiO2 versus Zr plot (Fig. 9) shows all the stream sediments plotting in felsic zone. Figure 5: Th/U vs. Th plot for stream sediments. Fields and trends from Gu et al. (2002) four (4) main Figure 6: Bivariate Plot of Na2O versus K2O of the studied sediments showing quartz content, after Crook (1974) @ IJTSRD | Available Online @ www.ijtsrd.com | Volume – 1 | Issue – 5 | July-Aug 2017 Page: 753
International Journal of Trend in Scientific Research and Development (IJTSRD) ISSN: 2456-6470 Figure 8: Discriminant function diagram using major elements for the provenance signatures of the sediments (After Roser & Korsch, 1988) According to Holland (1978); Bhatia and Crook (1986), elements such as Sc, Y, Ti, Zr, Th and Nb are appropriate for provenance and tectonic setting determination because of their relatively low mobility during sedimentary processes, and their short times in seawater (Holland, 1978; Taylor and McLennan, 1985; Cullers, 1988). These elements are transported quantitatively into clastic weathering and transport, and hence reflect the signature of the parent material (McLennan et al., 1983). The incompatible element pairs Th–Y, Th–Zr, and Th–Nb (Fig. 10) show the effect of heavy mineral concentration and felsic source. The samples showed positive correlation with Th, except for Sc that showed a weak sediments during negative correlation. Figure 9: TiO2-Zr plot for the sediments (Hayashi et al., 1997) Figure 10: Plots of Y, Nb, Zr and Sc versus Th for the stream sediments Thorium, Y, Zr and Nb abundances in source rocks will increase as their chemistry becomes more developed. The Th/Sc ratio is a sensitive index of the bulk composition of the source (Taylor and McLennan, 1985). The average Th/Sc ratio of the stream sediment is 1.5. The Th/Sc ratio for post- Archean rocks is usually ∼1, and greater than 1 for granitic rocks; for Archean and basic rocks the ratio is less than 1 (Taylor and McLennan, 1985). Zr/Sc ratio is highly sensitive to accumulation of zircon and serves as a proxy for identifying heavy mineral concentrations (Taylor and McLennan, 1985). The average Zr/Sc ratio of the sediments is 43, this value is greater than the UCC and PAAS values suggesting that the stream sediments are enriched in zircon. All elements involved in the ratios are also resistant to weathering processes (Taylor and McLennan, 1985; McLennan et al., 1993). Figure 11 (A) shows that the stream sediments exhibit a limited range, suggesting homogenization and possibly increased maturity during transport. Higher Zr/Sc and Th/Sc ratios in some of the samples suggests limited zircon concentration (Garver et al., @ IJTSRD | Available Online @ www.ijtsrd.com | Volume – 1 | Issue – 5 | July-Aug 2017 Page: 754
International Journal of Trend in Scientific Research and Development (IJTSRD) ISSN: 2456-6470 1996). The broad relationship between Th/Sc and Zr/Th for the studied samples further reveals that the addition of zircon to the sediments by sorting and recycling might have important influence on these ratios (Fig. 11B). The stream sediments have average Cr/Ni ratio 2.93 compared to 1.75 (UCC) and 2 (PAAS). The ratios suggest that Cr has undergone significant fractionation from source rock to sediment and no significant ultramafic component is present. Figures 12 (A and B) shows that the source rocks for the stream sediments are post-Archean.; the sediments show less scatter but higher Cr contents, indicating heterogenization and enrichment during weathering and transport. Figure 11: (A) and (B): Zr/Sc–Th/Sc ratio for the stream sediments showing zircon concentration (circle) and typical source rock compositions (McLennan et al., 1993). Figure 12: (A) Plot of Eu/Eu* versus GdN/YbN (after McLennan, 1989). (B) Cr–Ni plot for the stream sediments showing the plots in the post-Archean field (Taylor and McLennan, 1985) and fractionation from source rocks to the sediments. Cr/V–Y/Ni ratios also provide estimates of preferential concentration of chromium over other ferromagnesian elements (Hiscott, 1984; McLennan et al., 1993). The Cr/V ratio measures enrichment of Cr with respect to other ferromagnesian elements, whereas the Y/Ni ratio evaluates the relationship between the ferromagnesian trace elements (represented by Ni) and the HREE, using Y as a proxy (McLennan et al., 1993). Y/Ni ratios generally range across values typical of intermediate to felsic calc-alkaline rocks. Sediments derived from ultrabasic sources usually have high Cr/V ratios much greater than 1 coupled with low Y/Ni less than 1 (Hiscott, 1984). An average Cr/V ratio for sediments is 1.49, while the Y/Ni ratio is 0.98; indicating felsic source (Fig. 13). @ IJTSRD | Available Online @ www.ijtsrd.com | Volume – 1 | Issue – 5 | July-Aug 2017 Page: 755
International Journal of Trend in Scientific Research and Development (IJTSRD) ISSN: 2456-6470 Figure 13: Cr/V–Y/Ni plots for the stream sediments (After McLennan et al., 1993). Ultrabasic field of sands derived from ultrabasic rocks, after Ortiz and Roser, 2006 Totten et al. (2000) showed that Th/Sc ratios near a value of 1.0 are typical of the upper continental crust which tends to be more enriched in the incompatible element Th; whereas, a more mafic component has a ratio near 0.6 and tends to be more enriched in the compatible element Sc. The Th/Sc ratio for the samples studied ranges between 0.67 and 5.51 with an average of 1.52 (Figure 14A omits sample AG-8, while figure 14B has all the samples). Figure 14: Th vs. Sc plot. Fields and trends from Totten et al. (2000) Titanium is relatively immobile compared to other elements during sedimentary processes, and hence is a good indicator of source rock composition (McLennan et al., 1993). According to Floyd et al. (1989) immobile elements, such as Ti and Ni, can be used to determine the original lithological composition of rocks and to separate immature sediments derived from a magmatic source from normal mature sediments. The stream sediments plot within the area of an acidic or felsic source (Fig. 15A). The sources of a sedimentary rock suite can be determined using K versus Rb ratios that are generally comparable to standard continental crust values (Floyd et al., 1989). Figure 15B shows the samples plotting in the acidic/ intermediate composition zone. Average values of La/Co and Th/Co for the studied samples are 4.29 and 1.53 respectively. According to Cullers and Berendsen (1998), sands derived from granitoid sources show higher La/Co and Th/Co values than those derived from basic sources. Figure 16 shows the samples plotting close to the granodiorite and between granite and granodiorite, which suggests an intermediate to felsic source. @ IJTSRD | Available Online @ www.ijtsrd.com | Volume – 1 | Issue – 5 | July-Aug 2017 Page: 756
International Journal of Trend in Scientific Research and Development (IJTSRD) ISSN: 2456-6470 Figure 15: (A) TiO2 vs. Ni plot. Fields and trends after Gu et al., 2002 and Floyd et al. (1989). (B) K2O vs. Rb plot. Fields after Floyd and Leveridge (1987) Figure 16: Source rock discrimination diagram of the stream sediments (after Cullers and Berendsen 1998), in relation to average values of granites, basalts, granodiorite (Taylor, 2015) and upper continental crust (Taylor and McLennan, 1985; 1995) The triangular plot of La-Th-Sc (Fig. 17) of the analyzed samples suggest derivation from felsic rocks of granite and granodiorite composition. The stream sediments show a high Hf component typical of a passive margin source with an increasing old sediment component (Fig. 18). The high Hf value suggests concentration of heavy minerals by sorting. One sample plotted in the mixed felsic/basic source; majority plotted in the increasing old sediment component zone. However, In the ternary diagram of V-Ni-Th*10 (fig. 19), all the samples plotted in the mafic source area. @ IJTSRD | Available Online @ www.ijtsrd.com | Volume – 1 | Issue – 5 | July-Aug 2017 Page: 757
International Journal of Trend in Scientific Research and Development (IJTSRD) ISSN: 2456-6470 La This study Granite Granodiorite Basalt UCC Th Figure 17: La-Th-Sc ternary plot of the stream sediments (after Jahn and Condie, 1995). Composition of granite, granodiorite, basalt and UCC are also plotted as references Sc Figure 19: V-Ni-Th*10 plot of the stream sediments (Bracciali et al., 2007). Shaded areas represent composition of the felsic, mafic and ultramafic rocks. Paleoenviroment and Paleoclimate According to Wronkiewicz and Condie (1987) the degree of chemical weathering is a function of climate and rates of tectonic uplift. The increasing chemical weathering intensity suggests the decrease in tectonic activity and/or the change of climate towards warm and humid conditions which are more favourable for chemical weathering in the source region (Jacobson et al., 2003). The applicability of the ratios of SiO2/(Al2O3+K2O+Na2O) for paleoclimatic condition (Suttner and Dutta, 1986) during deposition of sediments in the basin is well recognized by many workers. Figure 20 shows the samples plotting in the arid and semi-arid climatic conditions, which reflects paleoclimatic condition during the deposition of stream sediments. A paleoclimatic bivariate log plot by Suttner and Dutta (1986) shows the samples plotting in the arid and semi-arid zone (fig. 21), this paleoclimatic condition weathering scenario. Figure 18: La/Th ratio vs. Hf plot. Fields after Floyd and Leveridge (1987) and Gu et al. (2002) will create moderate @ IJTSRD | Available Online @ www.ijtsrd.com | Volume – 1 | Issue – 5 | July-Aug 2017 Page: 758
International Journal of Trend in Scientific Research and Development (IJTSRD) ISSN: 2456-6470 that the sediments were deposited in an oxic environment. Several authors have used the Ni/Co ratios as a redox indicator (Bjorlykke, 1974; Dypvik, 1984; Dill, 1986; Brumsack, 2006; Nagarajan, 2007). The Ni/Co ratios below 5 indicate oxic environments, while ratios above 5 indicate suboxic and anoxic environments (Jones and Manning, 1994). The Ni/Co ratios for the stream sediments vary between 1.99 and 3.65 (average = 2.86), signifying deposition in oxygenated environment. Cu/Zn and (Cu+Mo)/Zn ratios can be used as redox parameters, high Cu/Zn ratios indicate reducing depositional conditions, while low Cu/Zn ratios suggest oxidising conditions (Hallberg, 1976). The ratio (Cu+Mo)/Zn is shown to be a relevant paleoredox indicator for bottom water and sediment surface. For the stream sediments, (Cu+Mo)/Zn ratios is between 0.07 and 0.24, which suggests oxic paleoenvironment. The Cu/Zn ratios for the stream sediments range from 0.06-0.23, with an average of 0.1 indicating more oxidising conditions. Vanadium solubility in natural waters, its extraction from seawater and absorption onto sediments are mainly influenced by redox conditions (Bellanca et al., 1996). V/Cr ratio has been used as an index of paleo-oxygenation (Bjorlykke, 1974; Shaw et al., 1990; Nagarajan, 2007) due to the incorporation of Cr in the detrital fraction of sediments and its possible substitution for Al in the clay structure (Kimura and Watanabe, 2001). The V/Cr ratios above 2 indicate anoxic conditions, whereas values below 2 suggest more oxidizing conditions (Jones and Manning, 1994). The V/Cr ratios of sediments range between 0.26 and 1.45 (average = 0.8), which indicates oxic environment. According to Hetzel et al. (2009), the V/Sc ratios below 9.1 indicate oxic depositional environment. V/Sc ratio for the stream sediments is between 5.75 and 8.09 (average = 6.9), indicating oxic environment. Ni is mainly enriched in organic-rich sediments where these metals are trapped with organic matter (Leventhal and Hosterman, 1982; Gilkson et al., 1985). V accumulates relative to Ni in reducing environments, where sulphate reduction is more efficient. The proportionality of these two elements V/(V+Ni) is very significant to delineate information on Eh, pH and sulphide activity in the depositional environment (eg. Madhavaraju and Lee, 2009). The V/(Ni+V) ratios below 0.46 indicate oxic environments, but ratios above 0.54 to 0.82 suggest suboxic and anoxic environments (Hatch and Leventhal, 1992). The V/(Ni + V) ratios for the stream sediments range from 0.53 to 0.80 (Avg. = Figure 20: Bivariate plot of SiO2 vs. (Al2O3 + K2O + Na2O) to discriminate paleoclimatic condition during the deposition of the stream sediments (after Suttner and Dutta, 1986) Figure 21: Bivariate log/log plot of the ratio of polycrystalline to feldspar plus rock fragments against the ratio of total quartz to feldspar plus rock fragments (after Suttner and Dutta, 1986) Based on Weltje et al. (1998) diagram (fig. 22), the stream sediments plotted in number 2 fields, which point to the sedimentation on either a low-relief with a temperate and sub-humid climate or on tropical, humid conditions within an area with a moderate relief. The accumulation of certain trace metals in sediments is directly or indirectly controlled by redox conditions through either a change in redox state and/or speciation. Element ratios such as U/Th, Ni/Co, Cu/Zn, (Cu+Mo)/Zn and V/Cr, have been used to evaluate paleoredox conditions. The U/Th ratio is higher in organic rich mudstones compared to sandstones (Jones and Manning, 1994). U/Th ratios below 1.25 suggest oxic conditions of deposition; values above 1.25 indicate suboxic and anoxic conditions ((Jones and Manning, 1994; Hallberg, 1976). The stream sediments have U/Th ratio ranging from 0.29 to 1.28 with an average of 0.73, which indicates @ IJTSRD | Available Online @ www.ijtsrd.com | Volume – 1 | Issue – 5 | July-Aug 2017 Page: 759
International Journal of Trend in Scientific Research and Development (IJTSRD) ISSN: 2456-6470 1-4 refer to the semi-quantitative weathering indices defined on the basis of relief and climate as indicated in the table. CONCLUSION 0.7), which indicate suboxic to anoxic environment of deposition. The Mn* value is an important paleochemical indicator of the redox conditions of the depositional environment (Bellanca et al., 1996; Cullers, 2002; Machhour et al., 1994). The expression for calculating Mn* value Mn*=log[(Mnsample/Mnshales)/(Fesample/Feshales)], where the values used for the Mnshales and Feshales are 600×10-6 and 46150×10-6, respectively (Wedepohl, 1978). The reduced iron and manganese form different solubilities of compounds across a redox boundary, while manganese tends to accumulate in more oxygenated conditions above the redox boundary (Bellanca et al., 1996). The stream sediments have mostly negative Mn* values ranging from -0.53 to 0.31 with an average of -0.08, This suggests that the sediments may have been deposited in oxic and suboxic paleoenviromental and paleoclimatic analyses indicate that the stream sediments were deposited under oxic and perhaps early suboxic conditions. The paleoclimate during deposition of some stream sediments in Ijero-Ekiti SiO2/(Al2O3+K2O+Na2O) ratio showed that the sediments were formed under arid/semi-arid conditions. The weathering indices: CIA, CIW, PIA, MIA, Th/U ratio and the A–CN–K Ternary diagram indicate a moderate degree of weathering of the source. The sediments are quartz-rich and enriched in both TiO2 and Zr, which implies that they may have originated from a felsic source. The provenance discriminant function plot puts them mainly in the felsic igneous and quartzose sedimentary zones. Other provenance indicators like the TiO2 versus Zr plot, Ti versus Ni, K versus Rb, Cr/V and Y/Ni ratios revealed that the samples are of acidic/felsic intermediate composition. The ternary plot of La-Th-Sc suggest derivation from felsic rocks of granite and granodiorite composition. However, the V-Ni-Th*10 plot indicates a mafic source. Elemental ratios such as U/Th, Ni/Co, Cu/Zn, (Cu+Mo)/Zn, V/Cr and V/Sc indicate that the stream sediments were deposited under oxic conditions. V/(Ni+V) ratios indicate suboxic to anoxic environment of deposition while the Mn* values suggests oxic and suboxic environment. The paleoenviromental and indicate that the stream sediments were deposited under oxic and perhaps early suboxic conditions. based on is conditions. The paleoclimatic analyses ACKNOWLEGDEMENT The author sincerely acknowledges Mr. A. B. Eluwole for his contribution in the production of location map of the study area and geology students who participated in the field work. REFERENCE 1)Ajibade, A.C., Rahaman, M. A.,.and Ogezi A.E.O. 1988. The Precambrian geochronological summary. In: Oluyide P.O, et al. Precambrian geology of Nigeria, p. 44-58. 2)Armstrong-Altrin, J.S., Verma, S.P. 2005. Critical evaluation of six tectonic setting discrimination diagrams using geochemical data of Neogene of Nigeria, a Figure 22: Log-ratio plot after Weltje et al. (1998). Q: quartz, F: feldspar, RF: rock fragments. Fields @ IJTSRD | Available Online @ www.ijtsrd.com | Volume – 1 | Issue – 5 | July-Aug 2017 Page: 760
International Journal of Trend in Scientific Research and Development (IJTSRD) ISSN: 2456-6470 sediments Sedimentary Geology, 177(1-2): 115-129. 3)Armstrong-Altrin J.S., Lee Y.I., Verma S.P., and Ramasamy S. 2004. Geochemistry of sandstones from the Upper Miocene Kudankulam Formation, southern India: Implications for provenance, weathering, and tectonic setting J. Journal of Sedimentary Research. 74, 285–297. 4)Bellanca A., Claps M., Erba E., Masetti D., Neri R., Premolisilva I., and Venezia F. (1996), “Orbitally induced limestone/marlstone rhythms in the Albian-Cenomanian Cismon section (Venetian region, northern Italy): Sedimentology, calcareous and siliceous plankton distribution, elemental and isotope Paleogeography, Paleoclimatology Paleoecology. 126, 227–260. 5)Bhatia, M.R., 1983. geochemical composition of sandstones. J. Geol. 91, 611–627. 6)Bhatia, M.R., Crook, K.A.W., 1986. Trace element characteristics of graywackes and tectonic setting discrimination of sedimentary basins. Contrib. Miner. Petrol. 92, 181–193. 7)Bhatt, M.I. and Ghosh, S.K. 2001. Geochemistry of 2.51Ga old Rampur Group pelites, western Himalayas: Implications from their provenance and weathering. Precambrian Research, 108, 1-16. 8)Bjorlykke, K. (1974), mineralogical influence of Ordovician island arcs on epicontinental clastic sedimentation: a study of Lower Palaeozoic sedimentation in the Oslo region, Norway”, Sedimentology, 21(2), 251-272. 9)Black, R. 1980. Precambrian of West Africa. Episodes 4, p. 3–8. 10)Bock, B., McLennan, S.M., Hanson, G.N. 1998. Geochemistry and provenance of the Middle Ordovician Austin Glen Member (Normanskill Formation) and the Taconian Orogeny in New England. J. Sediment., 45, 635–655. 11)Bracciali, L., Marroni, M., Pandolfi, L., and Rocchi, S. (2007), petrography of Western Tethys Cretaceous sedimentary covers (Corsica and Northern Apennines): From source areas to configuration of margins”, in Arribas, J., Critelli, S., and Johnsson, M.J., eds., Sedimentary Petrogenesis: Perspectives from Petrography and Geochemistry: Geological Society of America Special Paper420, 73-93. 12)Brumsack, H. J. (2006), “The trace metal content of recent organic from known tectonic settings: implications formation”, Palaeoceanography, Palaeoecology, 232 (2–4), 344–361. 13)Burke, K.C., and Dewey, J.F. 1972. Orogeny in Africa. In: Dessauvagie TFJ, Whiteman AJ (eds), Africa geology. University of Ibadan Press, Ibadan, p. 583–608. 14)Chittleborough, D.J., 1991. Indices of weathering for soils and palaeosols formed on silicate rocks: Australian Journal of Earth Sciences, 38, 115– 120. 15)Condie, K.C., 1993. Chemical composition and evolution of the upper continental crust: contrasting results from surface samples and shales. Chemical Geology, 104, 1-37. 16)Condie K.C., Noll P.D., and Conway C.M. 1992. Geochemical and detrital mode evidence for two sources of Early Proterozoic metasedimentary rocks from the Tonto Basin Supergroup, central Arizona J. Sedimentary Geology. 77, 51–76 17)Crook K.A.W. 1974. geotectonics: The significance of compositional variation in flysch arenites (greywackes). Society of Economical, Mineralogical Special Publications. 19, 304–310. 18)Cullers, R.L. 1988. Mineralogical and chemical changes of soil and stream sediment formed by intense weathering of the Danburg granite, Georgia, U.S.A. Lithos 21(4), 301–314. 19)Cullers R.L. 1995. The controls on the major and trace element evolution of shales, siltstones and sandstones of Ordovician to Tertiary age in the Wet Mountain region, Colorado, U.S.A. J. Chemical Geology. 123, 107–131. 20)Cullers R.L. (2002), “Implications of elemental concentrations for provenanace, redox conditions, and metamorphic studies of shales and limestones near Pueblo, Co, USA”, Chemical Geology. 191, 305–327. 21)Cullers, R.L. and Berendsen, P. (1998), “The provenance and chemical variation of sandstones associated with the Midcontinent Rift System, U.S.A”, European journal of mineralogy, 10(5), 987-1002. 22)Cullers R.L. and Podkovyrov V.N. 2000. Geochemistry of the Mesoproterozoic Lakhanda shales in southeastern Implications for mineralogical and provenance control, and recycling J. Precambrian Research. 104, 77–93. for Cretaceous black shale Palaeogeography, geochemistry”, and Plate tectonics and Lithogenesis and Paleontological and “Geochemical and “Geochemistry and Provenance and Yakutia, Russia: carbon-rich sediments: @ IJTSRD | Available Online @ www.ijtsrd.com | Volume – 1 | Issue – 5 | July-Aug 2017 Page: 761
International Journal of Trend in Scientific Research and Development (IJTSRD) ISSN: 2456-6470 23)Dickinson W.R. 1985. Interpreting provenance relations from detrital modes of sandstones. In Provenance of Arenites (ed. Zuffa G.G.), pp.333– 361. Dordrecht-Boston-Lancaster. D. Reidel Pub. Co. 24)Dickinson W.R. 1988. Provenance and sediment dispersal in relation to paleo-tectonics, and paleo- geography of sedimentary basins In New Perspectives in Basin Analysis (eds. Kleinspehn K.L. and Paola C.), pp.3–25. New Springer Verlag. 25)Dill, H. (1986), “Metallogenesis of early Paleozoic graptolite shales from the Graefenthal Horst (northern Bavaria-Federal Republic of Germany”, Economic Geology, 81, 889-903. 26)Dypvik, H. (1984), “Geochemical compositions and depositional conditions of Upper Jurassic and Lower Cretaceous Yorkshire clays, England”, Geological Magazine,121(5), 489-504. 27)Duzgoren-Aydin, N. S., Aydin, A. and Malpas, J. 2002. Reassessment of chemical weathering indices: case study on pyroclastic rocks of Hong Kong. Engineering Geology, 63: p.99–119. 28)Elzien, S.M.; Farah, A. A. Alhaj, A. B.; Mohamed, A.A.; Al-Imam, O.A. O., Hussein, A. H.; Khalid, M. K., Hamed, B.O.; Alhaj, A. B. 2014. Geochemistry of Merkhiyat Sandstones, Omdurman Formation, Sudan: Implication of depositional environment, tectonic setting. International Journal of Geology, Agriculture and Environmental Sciences Volume – 2 Issue – 3:10-15. 29)Fedo C.M., Nesbitt H.W., and Young G.M. 1995. Unraveling the effects of potassium metasomatism in sedimentary rock sand paleosols, with implications for paleoweathering conditions and provenance. J. of Geology. 23, 921–924. 30)Fedo, C.M., Young, G.M., Nesbitt, H.W. and Hanchar, J.M. 1997. metasomatism in the Southern Province of the Canadian Shield: Paleoproterozoic Serpent Formation, Huronian Supergroup. Canada Precambrian Research, 84, 17-36. 31)Floyd, P.A., Winchester, J.A., and Park, R.G., 1989. Geochemistry and tectonic setting of Lewisian clastic metasediments from the early Proterozoic Loch Maree Group of Gairloch, NW Scotland: Precambrian Research v. 45, p. 203– 214. 32)Floyd, P.A., and Leveridge, B.E., 1987. Tectonic environment of the Devonian Gramscatho basin, south geochemical evidence from turbiditic sandstones, Journal of the Geological Society, London, v. 144, p. 531–542. 33)Garver, J.I., Royce, P.R., Smick, T.A., 1996. Chromium and nickel in shale of the Taconic foreland: a case study for the provenance of fine- grained sediments with an ultramafic source. J. Sediment. Res. A 66 (1), 100–106. 34)Gilkson M., Chappell B.W., Freeman R.S., and Webber E. (1985), “Trace elements in oil shales, their source and organic association with particular reference to Australian deposits”, Chemical Geology 53, 155–174. 35)Goldberg, K. and Munir Humayun, M., 2010. The applicability of the Chemical Index of Alteration as a paleoclimatic indicator: An example from the Permian of the Palaeogeography, Palaeoecology, 293, 175-183. 36)Grunsky, E.C., Drew, L.J., Sutphin, D.M. 2009. Process recognition in multi-element soil and stream-sediment geochemical Geochem. 24, 1602–1616. 37)Gu, X.X., Liu, J.M., Zheng, M.H., Tang, J.X., and Qt, L. 2002. Provenance and Tectonic setting of the Proterozoic turbidites in Hunan, South China: Geochemical Evidence: Journal of Sedimentary Research, v. 72, p. 393–407. 38)Halamic, J., Peh, Z., Bukovec, D., Miko, S., Galovic, L. 2001. A factor model of the relationship between geochemistry and adjacent lithology, Medvednica Mt., Croatia. Geol. Croat. 54 (1), 37–51. 39)Hallberg, R.O., and Халлберг, Р.O. (1976), “A Geochemical Method Paleoredox Conditions Геохимический метод исследований условий палеоредокса в осадках”, Ambio Special Report 4, 139-147. 40)Harnois, L. 1988. The C.I.W. index: a new chemical index of weathering. Sedimentary Geology, 55: p.319–322. 41)Hatch, J. R. and Leventhal, J. S. (1992), “Relationship between inferred redox potential of the depositional environment and geochemistry of the Upper Pennsylvanian (Missourian) Stark Shale Member of the Dennis Limestone, Wabaunsee County, Kansas, U.S.A”, Chemical Geology 99, 65–82. Cornwall; framework mode and Paraná Basin, Palaeoclimatology, Brazil. data. Appl. provenance and stream sediment basin drainage for Investigation Sediments of in / Potassic and sodic Evidence from the @ IJTSRD | Available Online @ www.ijtsrd.com | Volume – 1 | Issue – 5 | July-Aug 2017 Page: 762
International Journal of Trend in Scientific Research and Development (IJTSRD) ISSN: 2456-6470 42)Hetzel, A., Böttcher, M. E., Wortmann, U. G., Brumsack, H. (2009), “Paleo-redox conditions during OAE 2 reflected in Demerara Rise sediment geochemistry Palaeogeography, Palaeoecology 273, 302–328. 43)Hiscott, R.N., 1984. Ophiolitic source rocks for Tectonic-age flysch: trace element evidence. Geol. Soc. Am. Bull. 95 (1), 1261–1267. 44)Holland, H.D., 1978. The Chemistry of the Atmosphere and Oceans. Wiley, New York, 351 pp. 45)Jacobson A.D., Blum J.D., Chamberlian C.P., Craw D., and Koons P.O. (2003), “Climate and tectonic controls on chemical weathering in the New Zealand Southern Alps”, Geochimica et Cosmochimica Acta 37, 29–46. 46)Jahn, B.M. and Condie, K.C. (1995), “Evolution of the Kaapvaal Craton as viewed from geochemical and Sm-Nd isotopic analysis of intracratonic pelites”, Cosmochimica Acta59, 2239-2258. 47)Johnsson, M.J. and Basu, A., 1993. Processes Controlling the Composition of Clastic Sediments. Geological Society of America, 284(Special Paper), 342pp. 48)Jones, B. and Manning, D. A. C. (1994), “Comparison of geological indices used for the interpretation of palaeoredox conditions in ancient mudstones”, Chemical Geology 111, 111-129. 49)Kimura, H. and Watanabe, Y. (2001), “Oceanic anoxia at the Precambrian-Cambrian boundary” Geology, 21, 995-998. 50)Kirschbaum, A., Martinez, E., Pettinari, G. and Herrero, S., 2005. Weathering profiles in granites, Sierra Notre (Cordoba, Argentina). Journal of South American Earth Sciences, 19, 479–493. 51)Kroonenberg, S.B. 1994: Effects of provenance, sorting and weathering on the geochemistry of fluvial sands from different tectonic and climatic environments: Proceedings International Geological Congress, Part A, 69-81. 52)Leventhal J.S. and Hosterman J.W. (1982), “Chemical and mineralogical Devonian black-shale samples from Martin County, Kentucky; Carroll and Washington counties, Ohio; Wise County, Virginia; and Overton County, Tennessee, U.S.A”, Chemical Geology 37, 239–264. 53)Machhour L., Philip J., and Oudin J.L. (1994), “Formation of laminate deposits in anaerobic- Marine dysaerobic Geology117, 287–302. 54)Madhavaraju “Geochemistry of the Dalmiapuram Formation of the Uttatur Group (Early Cretaceous), Cauvery Basin,southeastern India: provenance and paleo-redox conditions”, Revista Mexicana de Ciencias Geológicas.26, 380–394. 55)McLennan, S.M. 1993. Weathering and global denudation. J.Geol., 101: p.295–303. 56)McLennan, S.M., Taylor, S.R., 1991. Sedimentary rocks and crustal evolution: Tectonic setting and secular trends. Journal of Geology, 99, 1-21. 57)McLennan, S.M., Taylor, S.R. and Eriksson, K.A. 1983. Geochemistry of Archean shales from the Pilbara Supergroup, Western Australia. Geochim. Cosmochim. Acta, 47: p.1211–1222. 58)McLennan, S.M., Hemming, S., McDaniel, D.K., Hanson, G.N., 1993. Geochemical approaches to sedimentation, provenance and tectonics. Geol. Soc. Am. Spec. Pap. 284, 21–40. 59)McLennan, S.M., Hemming, S.R., Taylor, S.R. and Eriksson, K.A. (1995), “Early Proterozoic crustal evolution: Geochemical and Nd-Pb isotopic evidence from metasedimentary rocks, southwestern North America”, Geochimica et Cosmochimica Acta59, 1159–1177. 60)Mongelli, G., Cullers, R.L. and Muelheisen, S. 1996. Geochemistry Oligocenic shales from the Varicolori Formation, southern Apennines, Italy: implications for mineralogical, grain-size control and provenance. Eur. J. Mineral., 8: p.733–754. 61)Nagarajan, R., Madhavaraju, J., Nagendral, R., Armstrong-Altrin., Moutte, “Geochemistry of Neoproterozoic shales of the Rabanpalli Formation, Bhima Basin, Northern Karnataka, southern India: implications for provenance and paleoredox conditions”, Revista Mexicana de Ciencias Geológicas, 24(2) 150-160 62)Nesbitt, H.W. and Young, G.M. 1982. Early Proterozoic climates and plate motions inferred from major element chemistry of lutites. Nature, 299: 715–717. 63)Nesbitt, H.W., Mackovics, G. and Price, R.C. 1980. Chemical processes affecting alkali sand alkaline Earth during continental weathering. Geochim. Cosmochim. Acta, 44: p.1659–1666. 64)Nesbitt, H.W., Young, G.M. 1989. Formation and diagenesis of weathering profiles. J. Geol., 97: p.129–147. marine environments”, J. and Lee Y.I. (2009), (ODP Palaeoclimatology, Leg 207)”, Implications on Geochimica et of Late Cretaceous- J.S.J. (2007), of the 29th analysis of @ IJTSRD | Available Online @ www.ijtsrd.com | Volume – 1 | Issue – 5 | July-Aug 2017 Page: 763
International Journal of Trend in Scientific Research and Development (IJTSRD) ISSN: 2456-6470 65)Nesbitt, H.W., Young, G.M., McLennan, S.M. and Keays, R.R. 1996. Effect of chemical weathering and sorting on the petrogenesis of siliciclastic sediments, with implications for provenance studies. J. Geol., 104: p.525–542. 66)Obaje, N. G., Musa, M. K. Odoma, A. N. and Hamza, H. 2011. The Bida Basin in north-central Nigeria: sedimentology and petroleum geology. Journal of Petroleum and Gas Exploration Research, Vol. 1(1) p. 001-013. 67)Okunlola, O. A. 2005. Metallogeny of Ta-Nb mineralization of Precambrian pegmatite of Nigeria. MINERAL WEALTH. pp.137. 68)Okunlola, O. A. and Akinola, O.O. (2010). Petrochemical characteristics of the Precambrian rare metal pegmatite of Oke Asa area, southwestern Nigeria: implication for Ta-Nb mineralization RMZ- Geoenvironment, vol. 57 (4), p. 525-538. 69)Ortiz, E., Roser, B.P., 2006. Major and trace element provenance sediments from the Kando river, San’in district, southwest Japan. Island Arc. 15, 223–238. 70)Oyawoye, M.O. 1972. The basement complex of Nigeria. In: Dessauvagie TFJ, Whiteman AJ (eds) African geology. Ibadan University Press, p. 66–102. 71)Paikaray S., Banerjee S., and Mukherji S. 2008. Geochemistry of shales from Paleoproterozoic to Neoprotzoic Vindhyan Super-group: Implications on provenance, tectonic and paleoweathering. Journal of Asia Earth Science. 32, 34–48. 72)Pe-Piper, G., Triantafyllidis, S. and Piper, D.J.W. (2008), “Geochemical identification of clastic sediment provenance from known sources of similar geology: the Cretaceous Scotian Basin, Canada”,Journal of Sedimentary Research78, 595–607. 73)Rahaman, M.A. 1976. Review of the basement geology of South-Western Nigeria. In: Kogbe C.A. (ed) Geology of Nigeria, 2nd ed., Elizabethan Publishers, Lagos, p. 41–58. 74)Rahaman, M.A. 1988. Recent advances in the study of the basement complex of Nigeria. In: Geological Survey of Nigeria (ed.) Precambrian Geol. Nigeria, p. 11–43. 75)Rahaman, M.A., and Ocan, O. 1978. On relationships in the Precambrian Migmatite- gneisses of Nigeria. Nig. J. Min. Geol., 15, p. 23– 32. 76)Reimann, C. and Melezhik, V. 2001. Metallogenic provinces, geochemical provinces and regional geology—what causes large-scale patterns in low density geochemical maps of the C-horizon of podzols in Arctic Europe? Appl. Geochem. 16, 963–983. 77)Roser BP. 2000. Whole-rock geochemical studies of clastic sedimentary suites. Mem. Geol. Soc. Japan 57: 73–89. 78)Roser, B. P. and Korsch, R. J. 1986. Determination of tectonic setting of sandstone- mudstone suites using SiO2 content and K2O/Na2O ratio. J. Geol., 94, p.635-650. 79)Roser, B. P. and Korsch, R. J. 1988. Provenance signature of sandstone-mudstone suite determined using discriminant function analysis of major element data. Chem. Geol., 67: p.119-139. 80)Shaw T.J., Geiskes J.M., and Jahnke R.A. (1990) Early diagenesis in environments: The response of transition metals in pore water. Geochimica et Cosmochimica Acta. 54, 1233–1246. 81)Suttner L.J. and Dutta P.K. (1986), “Alluvial sandstone composition and paleoclimate 1. Framework mineralogy”, Journal of Sedimentary Petrology. 56, 326–345. 82)Taylor S.R., and McLennan S.M. 1985. The Continental Crust: Its Composition and Evolution. An Examination of the Geochemical Record Preserved in Sedimentary Blackwell Science, Oxford. 83)Taylor S. R. and McLennan S. M. (1995), “The geochemical evolution of the continental crust”, Rev. Geophys.33, 241–265. 84)Taylor, S.R. (2015), “Geochemistry of Andesites. In Origin and Distribution of the Elements”, edited by L. H. Ahrens. International Series of Monographs in Natural Philosophy, 30, 559-582. 85)Totten, M.W., M.W., Hanan, M.A., and Weaver, B.L., 2000. Beyond whole-rock geochemistry of shales: The importance of assessing mineralogic controls for revealing tectonic discriminants of multiple sediment sources for the Ouachita Mountain flysch deposits: Geological Society of America Bulletin, v. 112, p. 1012–1022. 86)Turner, D.C. 1983. Upper Proterozoic schist belts in the Nigerian sector of the Pan-African Province of West Africa. Precamb. Res. 21, p. 55–79. 87)Voicu, G., and Bardoux, M. 2002. Geochemical behaviour under tropical weathering of the Barama-Mazaruni greenstone belt at Omai gold mine, Guiana Shield. Applied Geochemistry, 17: pp.321-336. differing depositional Materials and signatures in stream Rocks. pp.312. @ IJTSRD | Available Online @ www.ijtsrd.com | Volume – 1 | Issue – 5 | July-Aug 2017 Page: 764
International Journal of Trend in Scientific Research and Development (IJTSRD) ISSN: 2456-6470 88)Voicu, G., Bardoux, M., Harnois, L, and Grepeau, R. 1997. Lithological environment of igneous and sedimentary rocks at Omai gold mine, Guyana, South America. Exploration and Mining Geology, 6: pp.153-170. 89)Wedepohl K.H. (1978), “Manganese: Abundance in Common Sediments and Sedimentary Rocks”, Handbook of Geochemistry: Springer Berlin, 1−17. 90)Weltje, G.J., Meijer, X.D., De Boer, P.L. (1998), “Stratigraphic inversion of siliciclastic basin fills: a note on the distinction between supply signals resulting from tectonic and climatic forcing”, Basin Research, 10, 129–153. 91)Wronkiewicz, D.J. and Condie, K.C. (1987), “Geochemistry of Archean shales from the Witwatersrand Supergroup, South Africa: source- area weathering and provenance”, Geochimica et Cosmochimica Acta 51, 2401–2416. 92)Zimmermann, U and Bahlburg, H., 2003. Provenance analysis and tectonic setting of the Ordovician clastic deposits in the southern Puna Basin, NW Argentina: Sedimentology, 50, 1079– 1104. and geochemical @ IJTSRD | Available Online @ www.ijtsrd.com | Volume – 1 | Issue – 5 | July-Aug 2017 Page: 765