Download
1 / 27
270 likes | 400 Vues
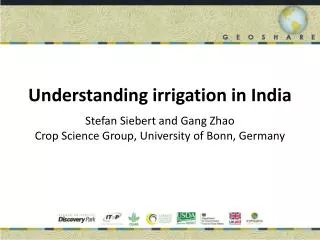
This study explores the complexities of irrigation in India, a country where 20% of land is irrigated yet supports 17% of the global population. It highlights the significant seasonal variations in drought stress, irrigation needs, and crop types, emphasizing the importance of tailoring strategies for both irrigated and rainfed agriculture. By developing a comprehensive dataset on India's monthly growing areas, this research aims to inform better agricultural practices, particularly in regions with multiple cropping systems. Insights are drawn through collaboration between the Crop Science Group at the University of Bonn and national data sources.

E N D
Understanding irrigation in India Stefan Siebert and Gang Zhao Crop Science Group, University of Bonn, Germany
Understanding irrigation in India Why India? • 20% of irrigated land • 17% of population • 11% of cropland • 14% of harvested • crop area Siebert et al., 2013 Motivation Methodology Results Discussion 02
Understanding irrigation in India Why India? Source: NIC, 2014 Source: NIC, 2014 Motivation Methodology Results Discussion 03
Aridity differs a lot between seasons! Drought stress and irrigation water requirements differ a lot between seasons! Data source: CRU, CGIAR CSI, 2014 Motivation Methodology Results Discussion 04
Data source: CRU, CGIAR CSI, 2014 Rice Rice Rice Wheat, Barley, Mustard Pearl Millet Pearl Millet Pigeon Pea Pigeon Pea Crops differ a lot between seasons! Motivation Methodology Results Discussion 05
Objective of the GEOSHARE pilot study: Develop dataset on monthly growing area of irrigated and rainfed crops in India based on fusion of national data Data source: MIRCA2000, Portmann et al., 2010 Irrigated crop fraction differs a lot between seasons! Motivation Methodology Results Discussion 06
Input data: 1)Crop – and season specific growing area statistics for irrigated and rainfed crops, per district, 2005/2006 NIC Land Use Statistics Motivation Methodology Results Discussion 07
Input data: 2) Crop advisories for 6 agro-meteorological zones, weekly, information per state IMD Motivation Methodology Results Discussion 08
Monthly irrigated and rainfed growing areas of following crops: District wise crop statistics (data set 1) + • Wheat • Maize • Rice • Barley • Sorghum • Pearl Millet (Bajra) • Finger Millet (Ragi) • Chick Pea (Gram) • Pigeon Pea (Tur) • Soybean • Groundnut • Sesame • Sunflower • Cotton • Linseed • Sugarcane • Tobacco • Fruits + vegetables • Condiments + spices • Fodder crops AgriMet crop advisories (data set 2) Motivation Methodology Results Discussion 09
Input data: 3) High resolution seasonal land use statistics (2004-2011) National Remotes Sensing Centre Motivation Methodology Results Discussion 10
Input data: 3) High resolution seasonal land use statistics (2004-2011) National Remotes Sensing Centre Multiple cropping Kharif only Rabi only Zaid only Permanent cropping Fallow Motivation Methodology Results Discussion 11
Using high resolution remote sensing data to disaggregate the district wise crop statistics Crop in survey based statistics (Dataset 1 + Dataset 2) Remote sensing based crops (Dataset 3) Perennial crops Plantation Multiple cropping Kharif season crops Kharif season only Rabi season only Rabi season crops Zaid season crops crops Zaid season only Fallow Motivation Methodology Results Discussion 12
Use of independent data => inconsistencies between survey based statistics and remote sensing data Adjusting remote sensing data: Step 1: using data from different years Motivation Methodology Results Discussion 13
Adjusting remote sensing data: Step 1: using data from different years Motivation Methodology Results Discussion 14
Adjusting remote sensing data: Step 2: using “fallow land” category to adjust season specific crop area Crop in survey based statistics (Dataset 1 + Dataset 2) Remote sensing based crops (Dataset 3) Perennial crops Plantation Multiple cropping Kharif season crops Kharif season only Rabi season only Rabi season crops Zaid season crops crops Zaid season only Fallow Motivation Methodology Results Discussion 15
Results Motivation Methodology Results Discussion 16
Results Motivation Methodology Results Discussion 17
Motivation Methodology Results Discussion 18
Results Motivation Methodology Results Discussion 19
Results Motivation Methodology Results Discussion 20
Discussion – Comparison to MIRCA2000 Motivation Methodology Results Discussion 21
Rice – cropping area – Comparison to MIRCA2000 Motivation Methodology Results Discussion 22
Rice – irrigated fraction – Comparison to MIRCA2000 Motivation Methodology Results Discussion 23
Conclusions • Consideration of data for seasonal crop distribution is required • for multiple cropping regions like India • The growing period differs a lot across regions, crop type and • irrigated versus rainfed crops • Remote sensing based products offer an opportunity to • maintain the observed seasonality of active vegetation in the • map products at high resolution Thank you !!! Motivation Methodology Results Discussion 24
Slides for discussion Motivation Methodology Results Discussion XX
Objective of the GEOSHARE pilot study: Develop dataset on monthly growing area of irrigated and rainfed crops in India based on fusion of national data Motivation Methodology Results Discussion XX
Rice – irrigated area – Comparison to MIRCA2000 Motivation Methodology Results Discussion XX