Additional file 4
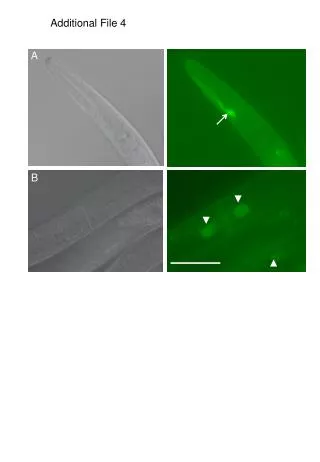
This study presents comparative gel images illustrating the analysis of cell-associated proteins from two Ralstonia solanacearum strains (A and B) using 2-D DIGE. The gels feature distinct staining (Cy3, Cy5, and Cy2) to represent different protein samples and an internal standard. Images display normalized spots, highlighting differentially expressed proteins between strains under varying conditions, such as temperature. This approach facilitates a clearer understanding of protein expression profiles, essential for further research on the pathogenicity and adaptation of these strains.

Additional file 4
E N D
Presentation Transcript
Additional file 4 Gel images for comparative experiment of two strains to illustrate the process of gel comparisons. Includes comparative gels and images with spots numbered and normalized for GMI1000 (strain A) and P673 (strain B) comparative gels of cell-associated proteins .
225 150 102 76 52 38 31 24 17 12 5/17/09 2D DIGE. 3-colored image of Ralstonia solanacearum total protein lysate. 100 ug each of Cy3 labeled 18°C-Strain A-1,Cy5 labeled 30°C-Strain A-1, and Cy2-internal standard were mixed and were focused in a 24 cm pH 3 to 11 NL IPG strip at 10000 V for 100 kVHr before analyzing in a 8 to 16% Tris Glycine SDS PAGE + MB-09-41-gel 1 Internal standard in blue, A18-1 in green, A30-1 in red
225 150 102 76 52 38 31 24 17 12 5/17/09 2D DIGE. 2-colored image of Ralstonia solanacearum total protein lysate. 100 ug each of Cy3 labeled 18°C-Strain A-1,Cy5 labeled 30°C-Strain A-1, and Cy2-internal standard were mixed and were focused in a 24 cm pH 3 to 11 NL IPG strip at 10000 V for 100 kVHr before analyzing in a 8 to 16% Tris Glycine SDS PAGE + MB-09-41-gel 1 A18-1 in green, A30-1 in red
Differentially expressed spots comparison A18-A30 A18-1 grey scale image
Differentially expressed spots comparison A18-A30 A30-1 grey scale image
225 150 102 76 52 38 31 24 17 12 5/17/09 2D DIGE. 3-colored image of Ralstonia solanacearum total protein lysate. 100 ug each of Cy3 labeled 30°C-Strain A-3,Cy5 labeled 18°C-Strain B-2, and Cy2-internal standard were mixed and were focused in a 24 cm pH 3 to 11 NL IPG strip at 10000 V for 100 kVHr before analyzing in a 8 to 16% Tris Glycine SDS PAGE + A30-3 in green, B18-2 in red, internal standard in blue MB-09-41-gel 2
225 150 102 76 52 38 31 24 17 12 5/17/09 2D DIGE. 2-color image of Ralstonia solanacearum total protein lysate. 100 ug each of Cy3 labeled 30°C-Strain A-3,Cy5 labeled 18°C-Strain B-2, and Cy2-internal standard were mixed and were focused in a 24 cm pH 3 to 11 NL IPG strip at 10000 V for 100 kVHr before analyzing in a 8 to 16% Tris Glycine SDS PAGE + MB-09-41-gel 2 A30-3 in green, B18-2 in red
225 150 102 76 52 38 31 24 17 12 + A30-3 grey scale image MB-09-41-gel 2
225 150 102 76 52 38 31 24 17 12 + B18-2 grey scale image MB-09-41-gel 2
225 150 102 76 52 38 31 24 17 12 5/17/09 2D DIGE. 3-colored image of Ralstonia solanacearum total protein lysate. 100 ug each of Cy3 labeled 30°C-Strain A-3,Cy5 labeled 30°C-Strain B-2, and Cy2-internal standard were mixed and were focused in a 24 cm pH 3 to 11 NL IPG strip at 10000 V for 100 kVHr before analyzing in a 8 to 16% Tris Glycine SDS PAGE + MB-09-41-gel 5 A30-3 in green, B30-2 in red, internal standard in blue
225 150 102 76 52 38 31 24 17 12 5/17/09 2D DIGE. 2-colored image of Ralstonia solanacearum total protein lysate. 100 ug each of Cy3 labeled 30°C-Strain A-3,Cy5 labeled 30°C-Strain B-2, and Cy2-internal standard were mixed and were focused in a 24 cm pH 3 to 11 NL IPG strip at 10000 V for 100 kVHr before analyzing in a 8 to 16% Tris Glycine SDS PAGE + MB-09-41-gel 5 A30-3 in green, B30-2 in red
225 150 102 76 52 38 31 24 17 12 Grey scale image of A30-3 + MB-09-41-GEL 5
225 150 102 76 52 38 31 24 17 12 Digital image of B30-2 + MB-09-41-gel 5
225 150 102 76 52 38 31 24 17 12 5/17/09 2D DIGE. 3-colored image of Ralstonia solanacearum total protein lysate. 100 ug each of Cy3 labeled 18°C-Strain B-3,Cy5 labeled 30°C-Strain B-3, and Cy2-internal standard were mixed and were focused in a 24 cm pH 3 to 11 NL IPG strip at 10000 V for 100 kVHr before analyzing in a 8 to 16% Tris Glycine SDS PAGE + MB-09-41-gel 7 B18-3 in green, B30-3 in red, internal standard in blue
5/17/09 2D DIGE. 2-colored image of Ralstonia solanacearum total protein lysate. 100 ug each of Cy3 labeled 18°C-Strain B-3,Cy5 labeled 30°C-Strain B-3, and Cy2-internal standard were mixed and were focused in a 24 cm pH 3 to 11 NL IPG strip at 10000 V for 100 kVHr before analyzing in a 8 to 16% Tris Glycine SDS PAGE 225 150 102 76 52 38 31 24 17 12 + MB-09-41-gel 7 B18-3 in green, B30-3 in red
Differentially expressed spots comparison B18-B30 Digital image of B18-3
Differentially expressed spots comparison B18-B30 Digital image of B30-3