Download
1 / 15
150 likes | 361 Vues
Farside Helioseismic Holography: Recent Advances. I. González Hernández (1), D. Braun (2), S. M. Hanasoge(3), F. Hill (1), C. Lindsey (2), P. Scherrer (3). (1) National Solar Observatory, Tucson, AZ (2) NorthWest Research Associates, Boulder, CO (3) Stanford University, Stanford, CA. Contents.

E N D
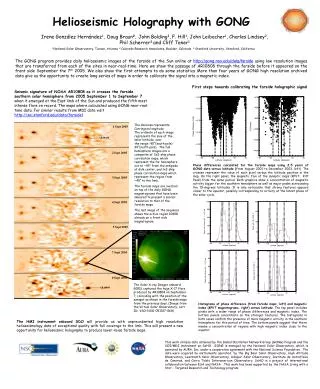
Farside Helioseismic Holography: Recent Advances I. González Hernández (1), D. Braun (2), S. M. Hanasoge(3), F. Hill (1), C. Lindsey (2), P. Scherrer (3) (1) National Solar Observatory, Tucson, AZ (2) NorthWest Research Associates, Boulder, CO (3) Stanford University, Stanford, CA
Contents • Seismic imaging or Helioseismic holography • Data: GONG near-real-time velocity images • Prediction capability: NOAA-10808 • Calibration of farside seismic holography signal • Collaborations • Conclusions and future work
Egression/Ingression Pupil Helioseismic Imaging of the Farside • Helioseismic imaging of sunspots at their antipodes. Lindsey, C. & Braun, D.C, 1990, SoPh. • Seismic Images of the Far Side and Interior of the Sun Lindsey, C. & Braun, D.C, 2000, Science.
Helioseismic Imaging of the Farside Phase of the Correlation • Phase-difference due to: • Reduction of gas pressure in magnetic region displacement of density variation “Acoustic Wilson depression” • Sound speed enhancement (evidence from acoustic moats) due to thermal anomalies • Inclination of the magnetic field
GONG near-real-time data • Continuous stream of velocity images • Quick calibration done at the sites • 215x215 Gaussian-smoothed velocity images • Transfer daily from six GONG stations • Images merged in Tucson http://gong.nso.edu/quickreduce/quickpulse.html • Farside maps calculated from 1440-min data series twice daily. • Maps calculated approx. 12 hours after the last image has been taken. • Recalculated if the duty-cycle increases due to extra transfer. • Full-hemisphere farside maps. http://soi.stanford.edu/farside http://gong.nso.edu/data/farside
Sept 7 2005 AR10808 Prediction capability Active Region NOAA-10808 Aug 29 Sep 9 2005 (GONG) sin(latitude) Carrington Longitude Source: MLSO K-coronameter
Magnetic calibration Φ B • Analysis of particular cases. • Location • Classification • Evolution of magnetic regions/sunspots • Frontside holography Relate phase-shifts calculated by seismic imaging with magnetic index on the visible sun. • Statistics, statistics: • GONG++ July 2001 present • Use Artificial data to calibrate the effect on the farside signal of different anomalies
Calibrating the farside signal Source: www.solarmonitor.org
Calibrating the farside signal Source: www.solarmonitor.org
Magnetic calibration Histograms of phase difference (from farside maps, left) and magnetic index (Kitt Peak magnetograms, right) versus latitude. The data used span from July 2001 to August 2003. The histograms in both cases seem to agree on the presence of more magnetic activity in the southern hemisphere for this period of time.
Magnetic Calibration Scatter plots of phase-shifts from the synoptic maps constructed from farside calculated images (Carrington Rotation 1996, left, and 2009, right) versus the square of the magnetic flux of the frontside synoptic maps from magnetograms (Kitt Peak)
Magnetic Calibration Artificial data with simulated “sunspot” • Angular size: 25 –40 degrees • Radial extend: 1Mm • Sound speed perturbation: Increase ~10% on average.
Irradiance Variation Courtesy of Juan Fontenla • Background blue quiet • Light Blue faint • Black network • Dark green active network • Bright green plage • (?) faculae • Dark red penumbra • Bright red umbra
Conclusions and future work • MDI and GONG pipelines are providing daily full-hemisphere farside maps. • Large active regions are seen in consecutive farside maps. • Scientific Calibration • Empirical calibration: Statistics with farside results +frontside analysis • Calibration of artificial “sunspots” • Calibrate effect of several bounces and dispersion relation • Ghost signature (?) • Collaboration with irradiance variation studies • Continue refining the technique to improve its capability as a space weather prediction tool