Marginal Costing & Break Even Analysis
150 likes | 601 Vues
Marginal Costing & Break Even Analysis. Marginal cost. The amount at any given volume of output by which the aggregate costs are changed if the volume of output is increased or decreased by one unit Assumptions: variable cost varies in direct proportion with the level of activity

Marginal Costing & Break Even Analysis
E N D
Presentation Transcript
Marginal cost • The amount at any given volume of output by which the aggregate costs are changed if the volume of output is increased or decreased by one unit • Assumptions: • variable cost varies in direct proportion with the level of activity • Per unit selling price remain constant • No variation due to stock
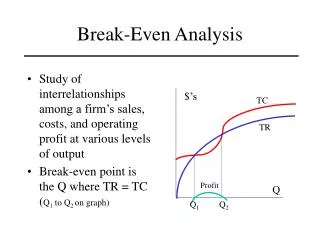
CVP relationship • Aims at studying the relationship existing among the factors and its impact on amount of profit • Relationship between: • Selling price per unit and total sales amount • Total cost • Volume of sales
Basic equation • Profit = Sales – Total cost • Profit = Sales – (Variable cost + Fixed cost) • Profit = Sales – Variable cost – Fixed cost • Profit + Fixed cost = Sales – Variable cost • Sales – Variable cost = Contribution = Fixed cost + profit • Contribution – Fixed cost = Profit
Profit Volume Ratio (P/V) • Indicates the contribution earned with respect to one rupee of sales • PV ratio = contribution / sales * 100 • PV ratio = change in profit / change in sales * 100 Means • Sales * PV ratio = Contribution • Contribution / PV ratio = Sales • Properties of PV ratio: • It remains constant at all the levels of activities provided per unit sales price & variable cost remains constant • PV ratio remains unaffected by any variation in fixed cost though overall profit may change • High PV ratio indicates high profitability – point to increase sales promotion efforts to increase sales volume • Low PV ratio indicates low profitability – efforts can be made to increase the profits by increasing selling price or by reducing variable cost. • Overall profitability can be increased by concentrating more on product having high PV ratio
Break Even Point • No profit no loss • Contribution = Fixed cost • BEP( in units) = Fixed cost / contribution per unit • BEP( in amount) = Fixed cost / PV ratio • Contribution beyond BEP is profit
Margin of Safety • Indicates soundness of business • High margin of safety – BEP is much below the actual sales • Margin of safety = Sales – BEP sales • Margin of safety = Sales – fixed cost/ PV ratio • Margin of safety = Sales * PV ratio – Fixed cost / PV ratio • Margin of safety = Contribution – Fixed cost/ PV ratio • Margin of safety = Profit / PV ratio