Download
1 / 21
210 likes | 414 Vues
Comparing RUC20 Precipitation Forecasts to NEXRAD Radar-Derived Precipitation Totals. Holly A. Anderson Dynamical Weather Prediction April 23, 2008. Lightning Cessation at KSC.

E N D
Comparing RUC20 Precipitation Forecasts to NEXRAD Radar-Derived Precipitation Totals Holly A. Anderson Dynamical Weather Prediction April 23, 2008
Lightning Cessation at KSC Melbourne, FL WSR-88D lowest elevation angle (0.5°) plan-view with cross-section. White dots are source sparks for Lightning Detection And Ranging (LDAR) lightning flashes. Red dashes (pluses) are negative (positive) National Lightning Detection Network (NLDN) cloud-to-ground (CG) lightning strike points.
How does NWP fit in? • Rapid Update Cycle (RUC) analysis data at a 20km resolution is used to compute the radar reflectivities at meteorologically-significant isotherms, such as the melting level and -10°C. • RUC data is also used to compute other parameters that help simulate the “near storm” environment. Clockwise from top left: K-Mean cluster based on 30-dBZ reflectivity, reflectivity at the 0°C isotherm, reflectivity at the -20°C isotherm, and reflectivity at the -10°C isotherm.
Forecasting Lightning Cessation • Using the RUC20 analysis data to compute the near-storm environment, and using radar-derived parameters, I hope to develop a scheme to forecast the last lightning flash of a thunderstorm. Melbourne WSR-88D radar-derived five-minute precipitation with NLDN CG strikes overlaid.
Comparing RUC20 to Observed Precipitation • Since I use RUC20 analysis data in my personal research, I decided to look into the RUC20 model, its specifications, and particularly its performance in forecasting precipitation. • For this project, I will compare the RUC20 precipitation forecasts to quality-controlled NEXRAD radar-derived precipitation totals. • Comparing the two datasets will demonstrate how the RUC20 model performs at predicting precipitation.
RUC20 Convective Parameterization • The RUC20 uses the Grell and Devenyi (2001) ensemble approach to parameterize convection: • Based on the Grell (1993) scheme but uses an ensemble of various closure assumptions: • ∂CAPE/∂t • Removal of total CAPE (Kain and Fritsch, 1992) in a specified time period • Low-level horizontal moisture convergence • Low-level mass flux at cloud base • A total of 108 closure assumptions are used in the Grell/Devenyi convective scheme. • For more information, see the RUC20 - NWS Technical Procedures Bulletin at ruc.noaa.gov/ppt_pres/RUC20-tpb.pdf.
Data Sources • RUC20 Model Forecasts • 00Z analysis • 6-hour forecast • 12-hour forecast • NEXRAD Stage-IV Precipitation Totals • Quality-controlled NEXRAD-derived data serves as “ground truth” observation. • Dates chosen: • March 31, 2008 • April 20, 2008
How did the RUC20 compare? • The RUC20 does a promising job of predicting the orientation and general areas of expected precipitation. • The RUC20 appears to over-forecast the spatial extent of precipitation. The “blobs” of predicted precipitation are much larger than the observed. • The RUC20 appears to under-forecast the actual amount of precipitation, especially in areas of heavy lines of convection.
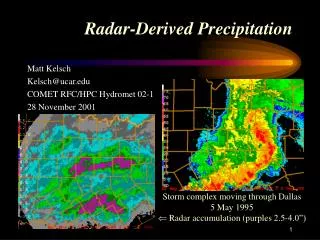
How does this affect my lightning cessation research? • This study reconfirms the fact that no model is perfect. • Luckily, for my research, I derive precipitation totals from observational NEXRAD data, since my thunderstorm cases are archived. • Right now, I don’t have to use RUC20 forecast data to predict precipitation. • However, when I develop the forecasting scheme, I may find myself utilizing RUC20 (or perhaps RUC13) data to predict future areas of precipitation that could be associated with lightning.