Download
1 / 18
220 likes | 571 Vues
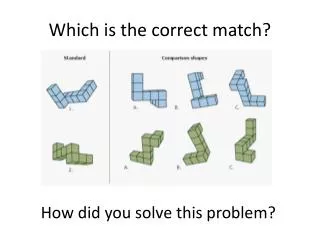
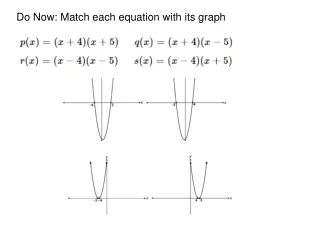
X (m). X (m). X (m). X (m). t (sec). t (sec). t (sec). t (sec). Match Each Position Graph to the Correct Description. 1 . Walk away from origin, speeding up. Graph A. Graph C . 2 . Stand Still. 3 . Walk away from origin, slowing down. 4 . Walk toward origin, speeding up.

E N D
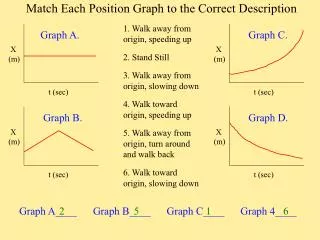
X (m) X (m) X (m) X (m) t (sec) t (sec) t (sec) t (sec) Match Each Position Graph to the Correct Description 1. Walk away from origin, speeding up Graph A. Graph C. 2. Stand Still 3. Walk away from origin, slowing down 4. Walk toward origin, speeding up Graph B. Graph D. 5. Walk away from origin, turn around and walk back 6. Walk toward origin, slowing down Graph A____ Graph B____Graph C____Graph 4____ 2 5 1 6
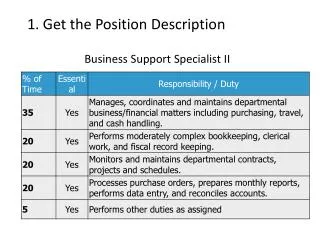
V (m/s) 0 t (sec) V (m/s) V (m/s) V (m/s) 0 0 0 t (sec) t (sec) t (sec) Match Each VELOCITY Graph to the Correct Description Graph A. 1. Walk away from origin, speeding up, then slow down Graph C. 2. Stand Still 3. Walk away from origin at a steady pace Graph B. Graph D. 4. Walk toward origin, speeding up 5. Walk away from origin, turn around and walk back 6. Walk toward origin at a steady pace Graph A____ Graph B____Graph C____Graph D____ 3 1 6 5
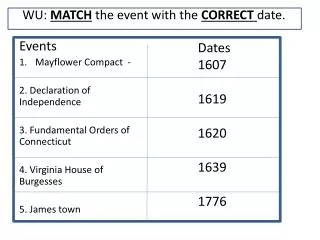
X (m) X (m) X (m) X (m) t (sec) t (sec) t (sec) t (sec) Which Object is Moving Faster (Greatest Speed)? Graph 3. Graph 1. B A B The magnitude of the slope of a position graph indicates the speed. The sign of the slope indicates the direction of the velocity. A Graph 4. Graph 2. B A A B Line A B. Line B C. Tie D. Can’t Tell Graph 1____ Graph 2____Graph 3____Graph 4____ A B C B
V (m/s) 0 t (sec) Which Object is Moving Faster (Greatest Speed)? Line A B. Line B C. Tie D. Can’t Tell B The speed is indicated by the distance from the X axis on a Velocity graph A Which Object is Ahead? Line A B. Line B C. Tie D. Can’t Tell A velocity graph does not indicate the initial position of the object. B could have had a head start.
V (m/s) B A 0 t (sec) Which Object is Moving Faster (Greatest Speed)? Line A B. Line B C. Tie D. First B, then A E. First A, then B Make sure you always look at the graph axes to see what type of graph it is Which Object is Ahead? Line A B. Line B C. Neither D. Can’t Tell What Does the Intersection Represent? A. They have the Same Position B. Same Velocity C. Same Speed, Opposite Direction D. They Turn Around
Create a Velocity Graph from a Position Graph (3.0, 3.5) Slope = 0 Velocity = 0 ∆x (0.5, 1.0) Velocity is the Slope of the Position Graph ∆t
Create Position Graph from a Velocity GraphDoes the Velocity Graph tell you Where to Start? No! Need to be given the initial position
Line Stays at 1 m while Velocity is ZeroHow Far Do You Go from 3 to 6 seconds?
You end up at 2.5 meter Position at 6 secondsHow Far Do You Go from 6 to 9 seconds?
You End Up Back Where You StartedWhat Does the Graph Do Next?
What is Average Speed While Moving? What is the Average Velocity While Moving?
More Correctly, It is the Area Between the line and the X axis Area “Under” a Velocity Graph is Displacement 0.5 m/s 3 s = 1.5 m -0.5 m/s 3 s = -1.5 m Area below X axis is negative displacement -1.5 m +1.5 m
Area “Under” a Velocity Graph is Displacement,even when Velocity Line has a Slope
Area “Under” a Velocity Graph is Displacement,even when the Velocity Line has a non-zero Slope Area = 4s .5 m/s = 2 m Area = 1/2 4s 0.5 m/s = 1m Area = 1/2 2s 0.5 m/s = 0.5 m Decreasing Slope Constant Slope Increasing Slope
E&P #17 + 0 - Position is negative to the left of the origin The velocity is the slope The velocity is the slope 1. When, if ever, is the animal to the left of the origin on the axis? (A) never (B) between t = 0 and t = 2 (C) none of these (D) between t = 2 and t = 4 (E) between t = 4 and t = 7 2. When, if ever, is its velocity negative? (A) never (B) between t = 3 and t = 7 (C) none of these (D) between t = 0 and t = 3 (E) between t = 2 and t = 4 3. When, if ever, is its velocity positive? (A) always (B) between t = 3 and t = 7 (C) none of these (D) between t = 0 and t = 3 (E) never 4. When, if ever, is its velocity zero? (A) around t = 1 (B) at t = 3 (C) between t = 2.5 and t = 4.5 (D) never (E) at t = 0
E&P #19 What is the total distance covered between 0 and 16 seconds by the runner whose velocity is shown above? (A) 128 m (B) 80 m (C) 100 m (D) Can’t tell (E) None of the above
V (m/s) 0 t (sec) V (m/s) V (m/s) V (m/s) V (m/s) 0 0 0 0 t (sec) t (sec) t (sec) t (sec) Which Graph Shows the Velocity of a Ball Thrown Straight Up, After it Leaves Your Hand? A B C D E