Download
1 / 23
230 likes | 340 Vues
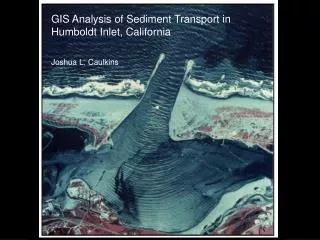
GIS Analysis of Sediment Transport in Humboldt Inlet, California Joshua L. Caulkins. Importance. Engineering 2001 US Spent $867,760 and dredged 268,465 yd 3 Mitigation Options Dredging is not cost effective. Rationale. Ultimate Goals.

E N D
GIS Analysis of Sediment Transport in Humboldt Inlet, California Joshua L. Caulkins
Importance Engineering 2001 US Spent $867,760 and dredged 268,465 yd3 Mitigation Options Dredging is not cost effective Rationale
Ultimate Goals • Better understanding of complex sediment transport processes within the coastal zone • Development of new methods with new technologies allow a focus on field studies over lab studies • Eventual quantification of sediment transport Rationale
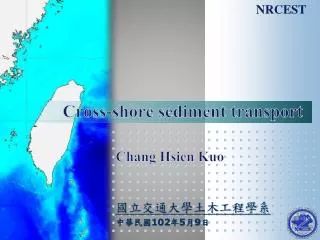
FLOW Background
Winter Summer Humboldt Inlet Characteristics 0.7 km 1.8 km 0.8 m/s 1 m/s
Peak Ebb Peak Flood Study Site
Data is spatially and temporally correlated within the channel. No Channel Survey No Channel Survey No channel overlap No Post-Dredge Data Time Line Channel Widening August 1999-March 2000 Dredging March-May (3/98 – 5/98) Dredging April-May (4/99 – 5/99) Dredging April-May (4/00 – 5/00) 1999 2000 2001 1998 7/98 1/00 5/00 8/00 1/ 98 4/99 Post-Dredge Survey (5/98 – 12/98) Pre-Dredge Survey (1/99 – 4/99) Post-Dredge Survey (5/99 – 12/99) Pre-Dredge Survey (1/00 – 4/00) Post-Dredge Survey (5/00 – 12/00) then second Condition Survey
Methodology: • Imported point bathymetry data into ArcMap GIS. • Created a Triangulated Irregular Network (TIN) from depth values. • Produced a value grid from the TIN and clipped the grid to the appropriate study area. • Calculated a difference map from the clipped grids of each data set. • Calculated a difference volume from the difference map.
Net Sediment Gain of 38,642 m^3 (or 50,542 yd^3)
Net Sediment Loss of 798,997 m^3 (or 1,045,049 yd^3)
Net Sediment Loss of 113,877 m^3 (or 148,945 yd^3)
Limitations of Current Analysis: • Lack of spatially and temporally correlated data limits depth of study. • The small study area does not allow for correction of material removed via dredging. • High shoaling areas are known but “reactionary logistics” still dominate maintenance of inlet.
Conclusions & Implications of Current Analysis: • Methodology is sound (Ham, Maguire) and cost effective. • Quantification ability at this scale is still in the early stages. More exploration into SHOALS or LIDAR data (remote sensing) would enable a more comprehensive analysis.