Download
1 / 27
270 likes | 387 Vues
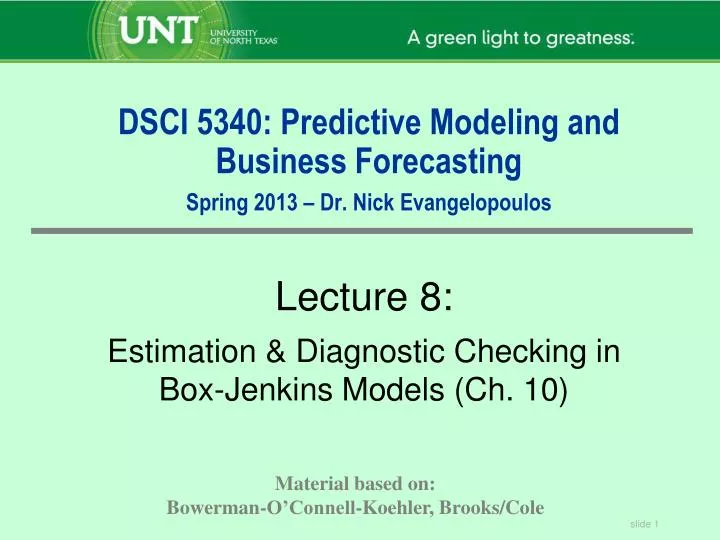
DSCI 5340: Predictive Modeling and Business Forecasting Spring 2013 – Dr. Nick Evangelopoulos. Lecture 8: Estimation & Diagnostic Checking in Box-Jenkins Models (Ch. 10). Material based on: Bowerman-O’Connell-Koehler, Brooks/Cole. Homework in Textbook. Page 443-445 Ex 9.5, Ex 9.6 Ex 9.7.

E N D
DSCI 5340: Predictive Modeling and Business ForecastingSpring 2013 – Dr. Nick Evangelopoulos Lecture 8: Estimation & Diagnostic Checking in Box-Jenkins Models (Ch. 10) Material based on: Bowerman-O’Connell-Koehler, Brooks/Cole
Homework in Textbook Page 443-445 Ex 9.5, Ex 9.6 Ex 9.7
EX 9.5 Page 443 • Assume time origin is 122. • y122 = 15.9265 is given. • Y122hat = 16.1880 from page 427 • Y122 – Y122hat = a122hat = 15.9265-16.1880 = -.2615
EX 9.5 Page 443 Y123hat • y123hat = y122hat + a123hat - q1hat*a122hat • Note that at time origin 122, we do know y122. • Note that we can compute a122hat since we know y122. • a123hat is zero since we do not know y123. • y123hat = y122hat + a123hat - q1hat*a122hat • y123(hat) = 15.9265 + 0 - (-.3534)(-.2615) =15.83409
EX 9.5 Page 443 Y124hat • y124hat = y123hat + a124hat - q1hat*a123hat • Note that at time origin 122, we do not know y123 – so we need to use y123hat. • Note that we cannot compute a123hat or a124 since we are at time origin 122. • y124hat = y123hat + a124hat - q1hat*a123hat • y124(hat) = 15.83409 + 0 - (-.3534)(0) =15.83409
EX 9.6 Page 443 • SAC cutoffs after lag 2. • SPAC dies down. • Second order moving average
EX 9.7 Page 445 Part a: Close call – first difference would be better.
EX 9.7 Page 445 part b SAC dies down and SPAC cuts off after lag of 2. AR(2) is best fit.
EX 9.7 Page 445 part c. • SPAC seems to die down slower than SAC. • Assuming SAC cuts off, we can say that SAC cuts off after lag 1. • Hence, MA(1).
Questions • 1. What is the name of the function that identifies the order of an autoregressive B-J model? SPAC – Sample Partial Autocorrelation function • 2. What is the name of the function that identifies the order of a moving average B-J model? SAC – Sample Autocorrelation function
Questions • 3. What happens to the mean and variance of an AR(1) model if the f1 coefficient is equal to 1? Greater than 1? • Mean is undefined for f1 value equal to 1 and has a sign opposite to that of the constant for a f1 value > 1. • Variance is undefined for value =1.
Questions 4. Is the model yt = yt-1 + at stationary or nonstationary? Why? • Note that yt = yt-1 + at implies • yt = (yt-2 + at-1) + at and this implies • yt = (yt-3 + at-2) + at-1 + at • So yt = at + at-1 + at-2 + … • The variance of yt is the sum of approximately infinite variances from each independent noise term. Each yt has higher variance then the one before it. • yt is not stationary. But zt = yt –yt-1 is stationary.
The Stationary Condition for an AR Model • The condition for stationarity of a general AR(p) model is that the roots of all lie outside the unit circle. • A stationary AR(p) model is required for it to have an MA() representation. • Example 1: Is yt = yt-1 + ut stationary? The characteristic root is 1, so it is a unit root process (so non-stationary) • Example 2: Is yt = 3yt-1- 0.25yt-2 + 0.75yt-3 +ut stationary? The characteristic roots are 1, 2/3, and 2. Since only one of these lies outside the unit circle, the process is non-stationary.
Invertibility of a MA process zt can be expressed as an infinite series of past z-observations. However, if the coefficients (weights) do not decline fast enough then the model will be unstable. Invertibility implies that recent observations count more heavily than distant past observations.
Point Estimates – Preliminary & Final • Computer Packages ( such as MINITAB and SAS) supply default preliminary estimates for time series models. These estimates must meet stationarity and invertibility conditions. • The easiest preliminary point estimate that almost always satisfies these conditions is the value of .1. • We can usually do better. For example, for an AR(1), the first order autocorrelation is equal to the autoregressive coefficient f1.
Building ARMA Models – The Box Jenkins Approach • Box and Jenkins (1970) were the first to approach the task of estimating an ARMA model in a systematic manner. There are 3 steps to their approach: 1. Identification 2. Estimation 3. Model diagnostic checking Step 1: - Involves determining the order of the model. - Use of graphical procedures - A better procedure is now available
Building ARMA Models – The Box Jenkins Approach (cont’d) Step 2: - Estimation of the parameters - Can be done using least squares or maximum likelihood depending on the model. Step 3: - Model checking Box and Jenkins suggest 2 methods: - deliberate overfitting - residual diagnostics
Ljung-Box Values in SAS printout Large p-values under Pr > ChiSq indicate that the model is adequate.
MINITAB Example of Ljung-Box Statistic Large p-values indicate no more terms need to be added to model.
Prediction Intervals np is the number of parameters being estimated in the model.
Homework in Textbook Page 480 Ex 10.1 through 10.6