Download
1 / 18
180 likes | 297 Vues
This study utilizes the Advanced Time-Ordered Particle (ATOP) ocean model to analyze surface water exchange in the Western North Pacific, East China Sea, and South China Sea. By processing real-time buoy data, we compute current velocity and wind speed, determining the movement of surface particles across various grid points. The research employs mathematical transformations to track particle trajectories, facilitating the understanding of ocean dynamics and enhancing marine resource management and environmental monitoring efforts in these critical regions.

E N D
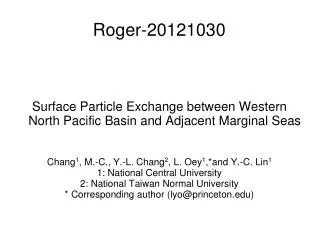
Surface Particle Exchange between Western North Pacific Basin and Adjacent Marginal Seas Chang1, M.-C., Y.-L. Chang2, L. Oey1,*and Y.-C. Lin1 1: National Central University 2: National Taiwan Normal University * Corresponding author (lyo@princeton.edu) Roger-20121030
abstract 緣起:隨著數值化的物理海洋模式發展趨向完善,大部分的海洋參數都可以模擬,如海流,海面高度,海溫,鹽度等等。ATOP便是其中之一,從2012年3月起,ATOP模式提供了以真實時間軸的預報,且ATOP內也有浮標等模組。本研究希望利用這些浮標模組產生的資料來探討在西北太平洋,東海,南海間表面海水交換作用。
Method Use the model result data. Get the surf & wind velocity, and compute the angle of the model grid point. Then get every grid point's particle velocity(U&V). Sx=(Ucos+Vsin)*T ,Sy=(Vcos+Usin)*T if T>0, forward ,elseif T<0 backward. Get The Sx,Sy , then convert Sx,Sy to lonadd and latadd . lonadd=(Sxcos+Sysin)/(1852*60), latadd=(Sycos+Sxsin)/(1852*60) (lonnext,latnext)=(lonnow,latnow)+(lonadd,latadd ) 使用ATOP模式所產生出來的資料,取出洋流速度,風速,並計算模式中每個模式格點中的夾角。利用這些資料求出每個模式格點內浮標的流速,再求出流動的距離轉換回流動的經緯度,便可以求出下一步浮標的經緯度。
Area Divide W3 <200m W4 <200m E4 130E E3 18N W2 E2 12.5N W1 9N E1 ? 0-35N & 100-170E
Initial Particle Positions W4 E4 E3 W3 W2 E2 W1 E1
Taiwan & China Coast Drifter Example • Green: release point • Red: end point • Period1: 2/12~4/11
Backward Particle-Tracking for Apr/11 ~ Feb/12 (A) (B) (C) (D) (E) (F) (G) (H) (I) Start Stop
Taiwan & China Coast Drifter • Period2: 4/12~6/11
Taiwan & China Coast Drifter • Period3: 6/12~8/25
Taiwan & China Coast Drifter • Period4: 8/26~10/29