Download
1 / 17
170 likes | 316 Vues
Table 3.1.1: Stock and Flow of Heart Transplantation, 1997-2005. N.B. There was no heart transplants carried out in 2004. New transplant patients. Alive at 31st December. 8. 7. 6. 5. Number of patients. 4. 3. 2. 1. 0. 1997. 1999. 2001. 2003. 2005. 1998. 2000. 2002. 2004.

E N D
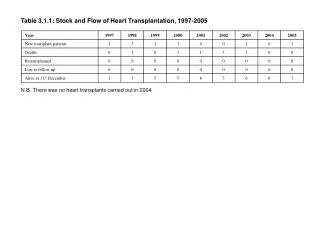
Table 3.1.1: Stock and Flow of Heart Transplantation, 1997-2005 N.B. There was no heart transplants carried out in 2004
New transplant patients Alive at 31st December 8 7 6 5 Number of patients 4 3 2 1 0 1997 1999 2001 2003 2005 1998 2000 2002 2004 Year Figure 3.1.1: Stock and Flow of Heart Transplantation, 1997-2005
Table 3.2.1: Gender distribution, 1997-2005 Table 3.2.2: Ethnic group distribution, 1997-2005
Table 3.2.3: Age distribution, 1997-2005 Age=date of transplant-date of birth
Table 3.3.1: Heart Procedure, 1997-2005 Table 3.3.2: Immunosuppressive used, 1997-2005
Table 3.3.3: Immunosuppressive used at time of last follow-up up to 2005 *Data according to year of transplant of patient
Table 3.3.4: Duration of waiting time on waiting list, 1997-2005 *Duration=date of transplant-date added to wait list
Table 3.4.1: Post Transplant Events at last follow-up up to 2005 *Data according to year of transplant of patient
Table 3.4.2: Post Transplant Malignancies at follow-up up to 2005 *Data according to year of transplant of patient
Table 3.4.3: Non-compliance at follow-up up to 2005 *Data according to year of transplant of patient
Table 3.4.4: Patient treated for rejection at follow-up up to 2005 *Data according to year of transplant of patient
Table 3.4.5: Time of deaths, 1997-2005 *Time=Date of death–date of transplant
Table 3.4.6: Patient survival, year of transplant 1997-2005 SE = standard error *Duration = date follow up-date transplant, if alive at discharge = date of discharge-date of transplant, if dead at discharge
1.00 0.75 Cumulative survival 0.50 0.25 0.00 0 1 2 3 4 5 6 7 8 Duration in years Figure 3.4.6: Patient survival, year of transplant 1997-2005