Download
1 / 38
620 likes | 2.08k Vues
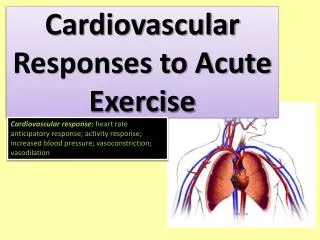
chapter. 7. Cardiorespiratory Responses to Acute Exercise. Cardiovascular Response to Acute Exercise. Heart rate (HR), stroke volume (SV), and cardiac output (Q) increase. Blood flow and blood pressure change.

E N D
chapter 7 Cardiorespiratory Responses to Acute Exercise
Cardiovascular Response toAcute Exercise . • Heart rate (HR), stroke volume (SV), and cardiac output (Q) increase. • Blood flow and blood pressure change. • All result in allowing the body to efficiently meet the increased demands placed on it.
Resting Heart Rate • Averages 60 to 80 beats per minute (bpm); can range from 28 bpm to above 100 bpm • Tends to decrease with age and with increased cardiovascular fitness • Is affected by environmental conditions such as altitude and temperature
Maximum Heart Rate • The highest heart rate value one can achieve in an all-out effort to the point of exhaustion • Remains constant day to day and changes slightly from year to year • Can be estimated: HRmax = 220 – age in years
Changes in Heart Rate as a Subject Walks, Jogs, Then Runs on a Treadmill
Steady-State Heart Rate • Heart rate plateau reached during constant rate of submaximal work • Optimal heart rate for meeting circulatory demands at that rate of work • The lower the steady-state heart rate, the more efficient the heart
Increase in Heart Rate With Increasing Power Output and Oxygen Uptake Reprinted, by permission, from P.O. Astrand et al., 2003, Textbook of work physiology, 4th ed. (Champaign, IL: Human Kinetics), 285.
Stroke Volume • Determinant of cardiorespiratory endurance capacity at maximal rates of work • May increase with increasing rates of work up to intensities of 60% of max • May continue to increase up through maximal exercise intensity • Depends on position of body during exercise
Changes in Stroke Volume (SV) as a Subject Exercises on a Treadmill
Stroke Volume IncreasesDuring Exercise • Frank Starling mechanism: more blood in the ventricle causes it to stretch more and contract with more force • Increased ventricular contractility (without end-diastolic volume increases) • Decreased total peripheral resistance due to increased vasodilation of blood vessels to active muscles
Cardiac Output • Resting value is approximately 5.0 L/min. • Increases directly with increasing exercise intensity to 20 to 40 L/min. • Value of increase varies with body size and endurance conditioning. • When exercise intensity exceeds 60%, further increases in Q are more a result of increases in HR than SV. .
. Changes in Cardiac Output (Q) as a Subject Exercises on a Treadmill
Changes in (a) Heart Rate, (b) Stroke Volume, and (c) Cardiac Output With Changes in Posture b a c
Cardiovascular Drift • Gradual decrease in stroke volume and systemic and pulmonary arterial pressures and an increase in heart rate • Occurs with steady-state prolonged exercise or exercise in a hot environment
Blood Pressure Cardiovascular Endurance Exercise • Systolic BP increases in direct proportion to increased exercise intensity. • Diastolic BP changes little, if at all, during endurance exercise, regardless of intensity. Resistance Exercise • It exaggerates BP responses to as high as 480/350 mmHg. • Some BP increases are attributed to the Valsalva maneuver.
Blood Pressure Responses to Both Leg and Arm Cycling at the Same Relative Rates of Oxygen Consumption Adapted, by permission, from P.-O. Astrand et al., 1965, "Intraarterial blood pressure during exercise with different muscle groups," Journal of Applied Physiology 20: 253-256.
Distribution of Cardiac Output at Rest and During Exercise Data from A.J. Vander, J.H. Sherman, and D.S. Luciano, 1985, Human physiology: The mechanisms of body function, 4th ed. (New York: McGraw-Hill Companies).
Key Points Cardiovascular Response to Exercise • As exercise intensity increases, heart rate, stroke volume, and cardiac output increase to get more blood to the tissues. • More blood forced out of the heart during exercise allows for more oxygen and nutrients to get to the muscles and for waste to be removed more quickly. • Blood flow distribution changes from rest to exercise as blood is redirected to the muscles and systems that need it. (continued)
Key Points (continued) Cardiovascular Response to Exercise • Cardiovascular drift is the result of decreased stroke volume, increased heart rate, and decreased systemic and pulmonary arterial pressure due to prolonged steady-state exercise or exercise in the heat. • Systolic blood pressure increases directly with increased exercise intensity while diastolic blood pressure remains constant. • Blood pressure tends to increase during high-intensity resistance training, due in part to the Valsalva maneuver.
Arterial–Venous Oxygen Difference • Amount of oxygen extracted from the blood as it travels through the body. • Calculated as the difference between the oxygen content of arterial blood and venous blood. • Increases with increasing rates of exercise as more oxygen is taken from blood. • The Fick equation represents the relationship of the body’s oxygen consumption (VO2) to the arterial–venous oxygen difference ((a-v)O2 diff) and cardiac output (Q); VO2 = Q(a-v)O2 diff.
– Changes in the (a-v)O2 Difference From Low Levels to Maximal Levels of Exercise
Blood Plasma Volume • Reduced with onset of exercise (goes to interstitialfluid space). • More is lost if exercise results in sweating. • Excessive loss can result in impaired performance. • Reduction in blood plasma volume results in hemoconcentration.
Key Points - Blood Changes During Exercise • The (a-v)O2 difference increases as venous oxygen concentration decreases during exercise due to the body extracting oxygen from the blood. • Plasma volume decreases during exercise due to water being drawn from the blood plasma and out of the body as sweat. • Hemoconcentration occurs. Plasma fluid is lost, resulting in a higher concentration of red blood cells per unit of blood and, thus, increased oxygen-carrying capacity. • Blood pH decreases due to increased blood lactate accumulation with increasing exercise intensity.
- Did You Know . . . ? The increase in (a-v)O2 difference during strenuous exercise reflects increased oxygen use by muscle cells. This use increases oxygen removal from arterial blood, resulting in a decreased venous oxygen concentration.
The Ventilatory Response to Light, Moderate, and Heavy Exercise
Breathing Problems During Exercise Dyspnea is shortness of breath. During exercise this is most often caused by inability to readjust the blood PCO2 and H+ due to poor conditioning of respiratory muscles. Hyperventilation is an increase in ventilation that exceeds the metabolic need for oxygen. Voluntary hyperventilation reduces the ventilatory drive by increasing blood pH. Valsalva maneuver is a breathing technique to trap and pressurize air in the lungs; if held for an extended period, it can reduce cardiac output. This technique is often used during heavy lifts and can be dangerous.
Did You Know . . . ? . . Ventilation tends to match the rate of energy metabolism during mild steady-state activity. Both vary in proportion to the volume of oxygen consumed (VO2) and the volume of carbon dioxide produced by the body (VE).
Ventilatory Equivalent for Oxygen . . • The ratio between VE and VO2 in a given time frame. • Indicates breathing economy. • At rest, VE/VO2 = 23 to 28 L of air breathed per L VO2 per minute. • At maximal exercise, VE/VO2 = 30 L of air per L VO2 per minute. • Generally VE/VO2 remains relatively constant over a wide range of exercise levels. . . . . . . . .
Ventilatory Breakpoint • The point during intense exercise at which ventilation increases disproportionately to the oxygen consumption. • When work rate exceeds 70% VO2max, energy must be derived from glycolysis. • Glycolysis increases CO2 levels, which triggers a respiratory response and increased ventilation. .
Ventilatory Threshold • Point during intense exercise at which metabolism becomes anaerobic • Reflects the lactate threshold under most conditions, though the relationship is not always exact • Identified by noting an increase in VE/VO2 without a concomitant increase in the ventilatory equivalent for carbon dioxide (VE/VCO2) . . . .
Changes in Pulmonary Ventilation During Running at Increasing Velocities
Key Points Pulmonary Ventilation • The respiratory centers in the brain stem set the rate and depth of breathing. • Chemoreceptors respond to increases in CO2 and H+ concentrations or to decreases in blood oxygen levels by increasing respiration. • Ventilation increases upon exercise due to inspiratory stimulation from muscle activity, which causes an increase in muscle temperature and chemical changes in the arterial blood (which further increase ventilation). (continued)
Key Points (continued) Pulmonary Ventilation • Breathing problems associated with exercise include dyspnea, hyperventilation, and the Valsalva maneuver. • During mild, steady-state exercise, ventilation parallels oxygen uptake. • The ventilatory breakpoint is the point at which ventilation increases though oxygen consumption does not. • Anaerobic threshold is identified as the point at which VE/VO2 shows a sudden increase, while VE/VCO2 stays stable. It generally reflects lactate threshold. . . . .
Respiratory Limitations to Performance • Respiratory muscles may use more than 15% of total oxygen consumed during heavy exercise and seem to be more resistant to fatigue during long-term activity than muscles of the extremities. • Pulmonary ventilation is usually not a limiting factor for performance, even during maximal effort, though it can limit performance in highly trained people. • Airway resistance and gas diffusion usually do not limit performance in healthy individuals, but abnormal or obstructive respiratory disorders can limit performance.
Respiratory Regulation of Acid–Base Balance • Excess H+ (decreased pH) impairs muscle contractility and ATP formation. • The respiratory system helps regulate acid–base balance by increasing respiration when H+ levels rise. The increase in respiration allows more CO2 to be released in the blood (bound to bicarbonate) to be transported to the lungs for exhalation. • Whenever H+ levels begin to rise, from carbon dioxide or lactate accumulation, bicarbonate ions can buffer the H+ to prevent acidosis.
Tolerable Limits for Arterial Blood pH and Muscle pH at Rest and at Exhaustion
Effects of Active and Passive Recovery on Blood Lactate Levels