Download

1 / 41
420 likes | 711 Vues
Gene Expression and Gene Sequencing Using Cytology Specimens. 24 st Annual Advances in Cytology Cytology June 13, 2012. Jeffrey S. Ross, M.D. Albany Medical College Albany, NY rossj@mail.amc.edu. Gene Expression Profiling in Cytology. Can be performed on fresh FNA material

E N D
Gene Expression and Gene Sequencing Using Cytology Specimens 24st Annual Advances in Cytology Cytology June 13, 2012 Jeffrey S. Ross, M.D. Albany Medical College Albany, NY rossj@mail.amc.edu
Gene Expression Profiling in Cytology • Can be performed on fresh FNA material • Difficult to perform on FFPE cell block materials • Clinical utility limited to Oncology • Cancer of unknown primary site • Prognosis assessment • Prediction of response to targeted therapy • Prediction of response to conventional therapy
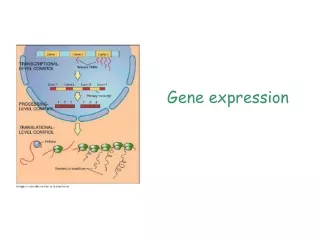
Gene Expression Profiling Techniques • RT-PCR • For individual genes • For genesets • Oncotype DX • Others • Genomic Micorarrays • For genesets • Mammaprint • Others • Mathematic Models and Algorithms • For results classification • For disease outcome prediction
Advantages of Cytology Specimens • Relatively easy to obtain new specimens • Ease of repeated sampling for therapy response information • Lower cost of sampling • FNA is Less invasive and better tolerated • Improved patient compliance • Tumor cell reduced cohesiveness enriches for malignant cells vsstromal and inflammatory cells
Disadvantages of Cytology Specimens • Small sample size • Lower mRNA yield • Reservoir of sample may be limited or absent • May lack relevant histologic correlation(s) • Tumor cell reduced cohesiveness enriches for malignant cells vs stromal and inflammatory cells
Expression Profiling for Disease Classification Examples • Lymphoma and Leukemia • Solid Tumors (Breast, Prostate, Colorectal and Lung Cancers) • Carcinoma of Unknown Primary Site • Microarray vs Multiplex RT-PCR
Microarray Classification of Non-Hodgkin’s Lymphoma Staudt. Cancer Cell Vol. 2, No. 5, 11/02: 363 - 366
Site of Origin for Metastatic AdenocarcinomaDennis et al Cancer Res 2002;62:5999-6005 Expression Profiles of 61 Genes by SAGE Established Tumor Markers by RT-PCR in Common Adenocarcinomas
Expression Profiling in Breast Cancer • Molecular Portraits • Molecular Grading • ER/PR Testing • HER2 Testing • Oncotype DxTM Recurrence Score by RT-PCR (Genomic Health) • MammaprintTM 70 Gene Recurrence Predictor (Agendia) • Other Multigene Predictors
Table 1. Comparison of Breast Cancer Multigene Predictor Test Platforms Feature IHC FISH CISH RT-PCR Microarray Starting Material FFPE FFPE FFPE or Fresh/Frozen Fresh/Frozen Slide Based/ Morphology Driven Yes Yes No No Requires Microdissection No No Yes Yes Processing Impact Yes Minimal Minimal No Number of Genes Tested Small Small Intermediate Large Type of Measurement Semi-quantitative Semi-quantitative Quantitative Quantitative Complexity of Statistical Algorithm Straight-forward Straight-forward Complex Highly Complex Comparison of Multigene Predictor Test Platforms (1)
Table 1. Comparison of Breast Cancer Multigene Predictor Test Platforms Potential for False Discovery Low Low Intermediate High Platform Feature IHC FISH CISH RT-PCR Microarray Ability to assess multiple pathways simultaneously Low Low Intermediate High Stand Alone Prognostic value Established Established Established Established Prediction of Response to Hormonal Therapies Established In current routine practice Not Established Established Not in current routine practice Established Not in current routine practice Prediction of Response to HER2 Targeted Therapies Established In current routine practice Established In current routine practice Established Not in current routine practice Established Not in current routine practice Comparison of Multigene Predictor Test Platforms (2)
Table 1. Comparison of Breast Cancer Multigene Predictor Test Platforms Prediction of Response to Cytotoxic Therapies Not established Not in current routine clinical practice Not established Not in routine practice Established In current routine clinical practice Established Not in current routine clinical practice Platform/Feature IHC FISH CISH RT-PCR Microarray Prediction of Therapy Toxicity Not established Not in current routine clinical practice Not established Not in routine practice Not established Not in current routine clinical practice Not established Not in current routine clinical practice Cost Comparatively Low ($100-400) Compara-tively Low ($300-600) Very High ($3,500 or higher) Very High ($3,500 or higher) Amenable to standardization Low Low Intermediate High Amenable to Automated Processing Intermediate Intermediate High High Comparison of Multigene Predictor Test Platforms (3)
Molecular Portrait of Breast Cancers Basal–like HER-2 “Normal Luminal B Luminal A Sørlie et al. Proc Natl Acad Sci U S A. 2001 Sep 11;98(19):10869-10874.
Molecular Grading of Breast Cancer • Gene expression profiling data indicates that there are 2 molecular grades of breast cancer • Histologic Grade 2 cases redistribute into Molecular Grades 1 and 2 • Molecular grading has outperformed histologic grading in multivariate analysis of traditional prognostic factors including ER/PR and HER2 status Patterns of expression of grade-related genes and their association with histologic grade (HG) and relapse-free survival. GGI score of each tumor is plotted below the corresponding column. Relapse-free survival times in years are indicated below the GGI scores. Sotiriou C, et al.. Gene expression profiling in breast cancer: understanding the molecular basis of histologic grade to improve prognosis. J Natl Cancer Inst. 2006 Feb 15;98(4):262-72.
Microscopic Grading in the Molecular Era • How can we reduce the number of grade II cases and increase the number of grade I and grade III tumors? • Grade II (3+3+1 = 7/9 “Moderately Differentiated”) • Architecture 3 • Nuclear grade 3 • Mitosis count 1 • Use Ki-67 labeling index to control for artifact low mitotic figure count in cases where tumors were left at room temperature for too long prior to fixation
ER Testing: Concordance Between IHC Status and mRNA Levels 25 20 15 10 5 0 Relative ER mRNA Expression + + + + + + + + + + + + ++ + + + + + + + + + + + - - - - - - - - - - - - - - - - - - - + - + - - ER Status by IHC on Core Needle Biopsies
HER-2 Testing: Is CISH the “Kish of Death” for FISH and IHC? • Will IHC continue to be the international method of choice for screening with 2+ cases triaged to FISH? • Will primary FISH testing become the standard? • Will mRNA detection gain in popularity? • Will the recently approved CISH (SISH) assay become the preferred method? • Will the ToGA Trial and FDA approval for trastuzumab in gastric/GEJ cancer change how HER2 testing is done? • Will pertuzimab and trastuzumab-DM1 require HER2+ testing prior to use?
IHC/FISH/CISH Concordance Overall FISH/CISH Concordance = 98% Hanna WM, Kwok K. Chromogenic in-situ hybridization: a viable alternative to fluorescence in-situ hybridization in the HER2 testing algorithm. Mod Pathol. 2006 Apr;19(4):481-7.
Multigene Classifiers and Predictors of Breast Cancer Clinical Outcome* *Ross, JS, Hatzis C, Symmans WF, Pusztai L, Hortobagyi GN. Commericalized multi-gene predictors of clinical outcome in breast cancer. Oncologist. 2008;13:477-493.
Multi-Gene Prognostic Tests • Pathways in common • Proliferation • Hormone Receptor • HER2 • Challenges for Clinical Acceptance • Associations are by chance only • Overfitting the data • Separate validation group must be used • Bias • Generalizability
Companion Diagnostics: Potential Uses in Cancer Drug Development • Biomarkers for drug response and drug-induced toxicity • Comparison of human response to pre-clinical animal models • Identify genes with variants that may define patient populations • Identify proteins as potential biomarkers • Shorten duration and lower cost of clinical trials by selecting patients more likely to respond and less likely to suffer toxicity • Improve patient compliance with “custom-designed” medicines • Achieve “best in class” status and premium pricing to overcome market segmentation
Important Anti-Cancer Drugs Requiring Companion Diagnostic Testing for Use • Tamoxifen and AI’s: ER/PR • Trastuzumab and Lapatinib: HER2 • Imatinib and Dasatinib: BCR:ABL, CKIT, PDGF • Cetuximab and Panitumumab: KRAS, (BRAF) • Gefitinib and Erlotinib: EGFR • Vemurafenib: BRAF • Crizotinib: EML4:ALK
Fine Needle Aspirate vs Core Biopsy FNA CBX More invasive Includes stromal, benign epithelial and inflammatory cells Average 55-60% Tumor Cells Less invasive Cell suspension enriched for tumor cells Average 80-85% Tumor Cells
Total RNA Yield From Single Pass FNA or Core Biopsy FNA: Usable RNA in 46 / 63 samples (73%) mean = 3.6 µg median = 2.2 µg CBX: Usable RNA in 15 / 20 samples (75%) mean = 2.8 µg median = 2.0 µg Symmans et al. Cancer 15;97(12):2960-2971
FNA vs Core Biopsy Conclusion • FNAs and CBxs are similarly suitable for transcriptional profiling • FNAs have significant advantages • More acceptable to patients, • Higher consent rate • Faster to perform • Less expensive • Provide A Higher Percentage Of Cancer Cells In The Sample • The Stromal Transcriptional Component Will Probably NOT Influence The Predictive Power Of Most Genomic Studies For: • Prognosis • Biology • Therapy Response (?)
DNA Sequencing in Cytology • DNA yield from FNAs may not always be satisfactory • Needle core biopsies now preferred • DNA can also be extracted from FFPE cellblocks from fluids and FNAs • Sequencing NSCLC FNAs is especially important • EGFR for gefitinib/erlotinib • EML4:ALK for crizotinib • KRAS for cetuximab (not approved in NSCLC) • EML4:ALK for crizotinib
Background (1) • Next Generation DNA Sequencing (NGS) has recently been applied to FFPE cancer biopsies and major resections (Ross JS et al. J ClinOncol 29: 2011) • Current Hot-Spot Genotyping only detects: • Mutations restricted to specific exons and codons • NGS detects: • Whole exome mutations in numerous cancer related genes • Insertions and deletions • Translocations and fusions • Copy number alterations (amplifications)
Background (2) • Recently, biomarker testing has emerged as a major driver of the selection of therapy for non-small cell lung cancer (NSCLC), colorectal cancer (CRC) and melanoma • Currently, “hot-spot” DNA sequencing and FISH are used to select therapies for solid tumors: • EGFR genotyping in NSCLC for tyrosine kinase inhibitor (erlotinib) • EML4:ALK translocation testing in NSCLC for crizotinib • KRAS mutation testing in CRC for cetuximab • BRAF mutation testing in melanoma for vemurafenib • The emergence of comprehensive genomic profiling by NGS has led investigators to question whether more thorough gene sequencing techniques could discover potential targets for the treatment of relapsed and metastatic NSCLC not currently searched for in current routine practice
Cancer Genome Profiling Workflow <14-21 days
EGFR Activating Mutation – NSCLC • Mutation: EGFR_c.2573T>G_p.L858R • Freq=32%, depth=53 • 79 year old white female • FNA of lung mass: NSCLC FNA sample cytocentrifuged and converted to an FFPE tissue block. Very small numbers of viable tumor cells. Extensively necrotic.
KRAS Mutation – CRC • Mutation: KRAS_c.35G>T_p.G12V • Freq=30%, depth=283 • 52 year old white male • KRASG12V mutation by “hot-spot” genotyping at Commercial Laboratory • pT3 pN2 pMx CRC Classic CRC with origin from mucosal surface at lower right
BRAF V600K Mutation – Metastatic MM • Mutation: BRAF_c.1798_1799GT>AA_p.V600K • Freq=10%, depth=416 • 77 year old white male • Thick melanoma of back • Multiple posterior cervical lymph nodes positive for metastatic melanoma Metastatic Melanoma to a cervical lymph node
EML4-ALK Translocation in NSCLC • PF-02341066 (PF-1066) “Critzotinib” • Oral ALK4 receptor kinase inhibitor • Phase I Trial on NSCLC patients with EML4-ALK translocation • “echinoderm microtubule-associated protein-like 4” – “anaplastic lymphoma kinase” • 10/19 (53%) had a partial response ASCO ‘09 • 76 patients detected by break-apart FISH ASCO ‘10 • ORR (overall response rate) 64% • DCR (disease control rate) 90% • Seen in 5-13% of adenocarcinomas • Papillary, solid and signet ring cell features • Mostly never or non-smokers • All ELM4-ALK Positive NSCLC is Negative for EGFR mutation • ELM4-ALK translocation can be detected by FISH or PCR • IHC for ALK available, but no outcome data for crtizotinib treated patients Shaw et al. J Clin Oncol. 27;2009:4247-4253.
NSCLC: JAK2 Mutation Detected by NGS Low power of pleural biopsy positive for adenocarcinoma • Sample: SM86 • Mutation: JAK2_c.1849G>T_p.V617F • Freq=4%, depth=205 • 77 year old white female • Lung adenocarcinoma diagnosed by pleural biopsy • Patient diagnosed with polycythemia vera c.1849G>T p.V617F High power view shows adenocarcinoma of the lung. Rare capillaries not blood filled. No nucleated RBC or blasts seen. G T A T G T G T C T G T G G A ValCys Val Cys Gly
HER2 Gene Copy Number Alteration Validation • Increased HER2 CNA detected by NGS • HER2 FISH Positive Breast Invasive Duct Carcinoma Demonstrating High HER2 CNA • HER2 Protein 3+ Expression by IHC ERBB2 RARA CONFIDENTIAL
cMET Copy Number Alteration in Clear Cell Ovarian Carcinoma Validation • cMET average CNA by FISH at APS is 6.6 using Abbott-Vysis Probes for cMET and CEP 7 • cMET IHC at APS shows H Score = 300 with 100% 3+ Membrane Staining • cMET gene CNA at FMI estimated at 6 copies in 40% purity CONFIDENTIAL
Novel ALK Fusion in CRC Detected by NGS pT4pN1pM1 Mucinous Adenocarcinoma associated with a serrated sessile polyp A 5,194,955-bp tandem duplication generates an in-frame C2orf44-ALK gene fusion RNA sequencing shows an 89.8-fold increase in expression of ALK beginning at exon 20 relative to exons 1–19. The RNA sequence of the C2orf44-ALK gene fusion shows aberrant splicing Lipson et al. Nature Med, Feb, 2012
Novel RET:KIF 5B Rearrangement in NSCLC (11.3Mb Pericentric Inversion) KIF5B RET Break Break KIF5B-RET ATG ATG • Translation 32,316,377 bps 43,611,118 bps Kinesin Coiled coil Tyrosine kinase • KIF5B(exons 1—15)RET(exons 12—20) ATG ATG ATG RET-KIF5B KIF5B-RET • Novel gene fusion joining exons 1-15 of KIF5B to exons 12-20 of RET in lung adenocarcinoma Lipson et al. Nature Med, Feb, 2012
Percentage Of Samples With Actionable Mutations Across Major Tissue Types • 71% cases carried ≥1 plausibly actionable mutation • 32 % cases carried ≥2 plausibly actionable mutations N=94 N=76 N=31 N=29 N=24 CONFIDENTIAL 39
Comparison of NGS with Traditional Hot-Spot Genotyping in NSCLC, CRC, Breast Cancer and Melanoma Also Detected by Hot-Spot Genotyping N = 111
Targeted Therapies for Cancer Molecular profiling is driving many new targeted cancer therapeutics • ~500 compounds hitting ~140 targets in development • Growing number of newly identified potential targets Subset of analyzed targets listed; data from BioCentury Online Intelligence Database