Variability
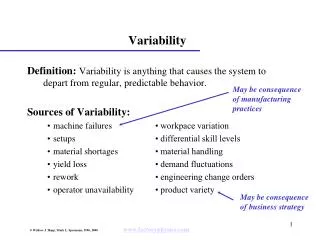
Variability. Variability refers to the Spread or Dispersion of the Distribution. Variability of the Distribution. (Common Statistics). Range Max - min Variance Average Squared Distance from Mean Standard Deviation Average Distance from Mean.


Variability
E N D
Presentation Transcript
Variability refers to the Spread or Dispersion of the Distribution
Variability of the Distribution (Common Statistics) • Range • Max - min • Variance • Average Squared Distance from Mean • Standard Deviation • Average Distance from Mean (Verbal definitions of Variance and Standard Deviation are not exactly right, but close enough to right and easy to remember.)
Range • Maximum – minimum. Quick, easy. • 2, 3, 4, 5, 5, 5, 6, 7. Range is 7 – 2 = 5 • 2, 3, 4, 5, 5, 5, 6, 19. Range is 19 – 2 = 17 What is the range for the distribution shown in the boxplot?
Variance Population Variance: Where means population variance, means population mean, and the other terms have their usual meaning. The variance is equal to the average squared deviation from the mean. To compute, take each score and subtract the mean. Square the result. Find the average over scores. Ta da! The variance. Think of this as the average squared distance from the mean. The farther scores are from the mean, the bigger the variance.
Standard Deviation • Variance is average squared deviation from the mean. • To return to original, unsquared units, we just take the square root of the variance. This is the standard deviation. • Population formula:
Standard Deviation • Sometimes called the root-mean-square deviation from the mean. This name says how to compute it from the inside out. • Find the deviation (difference between the score and the mean). • Find the deviations squared. • Find their mean. • Take the square root.
Two Population Distributions Both distributions have a mean of zero (mu). One has a standard deviation of 1.6, the other has a standard deviation of 10. The SD can be considered the average distance from the mean.
Example: Age Distribution What is the variance of this distribution (approximately)?
Heiman’s notation for Variance and Standard Deviation Stats builds. You have to understand and remember these.
Uses • Range is used when a simple description is desired or when the variance or standard deviation cannot be computed. • Standard Deviation is used to communicate the variability of the distribution. Has applications we will cover later. • Variance is used in many statistical calculations for significance tests.
Review • What is variability? • Define terms: • Range • Variance • Standard Deviation
Examples and Computation • Age from demographics • Grades from last semester
Computation • How do we compute the range statistic? • 1 99th percentile – 1st percentile • 2 75th quartile – 25th quartile • 3 maximum – minimum • 4 minimum – maximum
Definition • The standard deviation is an index of a distribution’s __________. • 1 central tendency • 2 kurtosis • 3 skew • 4 variability
Graphs • Which distribution appears to have the largest variance? 3 4 1 2
Graphs • Which graph shows a higher mean? • Young • Old • Same • Cannot tell • Which graph shows a higher standard deviation? • Young • Old • Same • Cannot tell
Graphs • Which graph shows a higher mean? • Young • Old • Same • Cannot tell • Which graph shows a higher standard deviation? • Young • Old • Same • Cannot tell