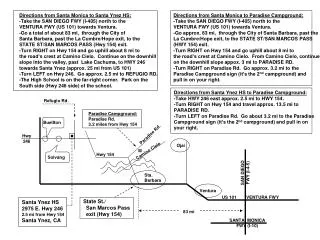
STA 2023
STA 2023 . Section 7.3 Hypothesis Testing for the Mean. Critical Value in a t-Distribution.


STA 2023
E N D
Presentation Transcript
STA 2023 Section 7.3 Hypothesis Testing for the Mean
Example 2: A local brewery distributes beer in bottles labeled 12 ounces. A government agency thinks that the brewery is cheating its customers. The agency selects 20 of these bottles, measures their contents, and obtains a sample mean of 11.7 ounces with a standard deviation of 0.7 ounce. Use a 0.01 significance level to test the agency's claim that the brewery is cheating its customers. • Answer: There is not sufficient evidence at the 1% level of significance to support the government agency's claim that the brewery is cheating its customers.
Example 3: A local group claims that the police issue more than 60 speeding tickets a day in their area. To prove their point, they randomly select two weeks. Their research yields the number of tickets issued for each day. The data are listed below. At α = 0.01, test the group's claim. 70 48 41 68 69 55 70 57 60 83 32 60 72 58 • Answer: There is not sufficient evidence at the 1% level of significance to support the claim that the police are issuing more than 60 speeding tickets a day.