Download
1 / 8
790 likes | 2.63k Vues
Assessment of biodiversity. Australia’s biodiversity Species richness Species Diversity Simpson’s Index. Things you need to know. Australia is internationally recognised as one of the 12 countries with major repositories of biological diversity and the only one with a developed economy.

E N D
Assessment of biodiversity Australia’s biodiversity Species richness Species Diversity Simpson’s Index
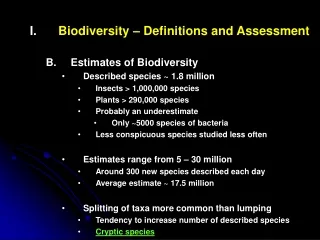
Things you need to know • Australia is internationally recognised as one of the 12 countries with major repositories of biological diversity and the only one with a developed economy. • The 12 regions combined account for 75% of the total biodiversity of the planet. • It is estimated that Australia has 450 000 species. This is 9% of all species on Earth.
Assessing biodiversity • Measuring the diversity for comparative purposes requires the ecologist to look at 3 distinct categories. • The number of species • Simply the number of species found in a given area • Species richness • The number of different species present, ranks each species present as equal. A rare species will be counted equally with a common species and even and introduced species. This term and the above are interchangeable. • Species diversity • Takes into account the relative abundance of each species present as well as the number of different species.
Simpson’s Diversity Index • This diversity index estimates the probability of two specimens belonging to the same species and was first developed in 1949 • Where: N= number of species • = sum of • Pi= the proportion of individuals belonging to species i. • The index gives relatively little weight to rare species and more weight to common species. • The higher the value the higher the diversity
Shannon-Weiner Diversity Index • Historically, the index has been used to measure the effects of habitat quality such as effects of pollution effluents. • Recently, this index has fallen out of favor because it doesn’t take into account habitat specific parameters required by specific species. • The symbols used are the same as those for Simpson's index. • The higher the value the higher the diversity
Example • As an example, let us work out the value of D for a single quadrat sample of ground vegetation in a woodland. Of course, sampling only one quadrat would not give you a reliable estimate of the diversity of the ground flora in the wood. Several samples would have to be taken and the data pooled to give a better estimate of overall diversity. How many samples?
Example Results. • Simpson’s index • D= 1-p2 • D= .496 • Shannon’s Index • H = 1.28 • Online calculator used • G:\Unit 3 Environmental Science\aos2 biodiversity\Biodiversity Calculator of the Simpson and Shannon-Wiener Indexes.mht
Endemism as a way to evaluate biodiversity • A species is considered to be endemic if it is restricted to that area only. • Why are the majority of Australian species endemic to this continent? • The endemism of the biodiversity of a region can be expressed as the percentage of endemic species present. • 90% of mammals, 93% of frogs,89% of vascular plants and reptiles are endemic to Australia. • Why would birds be much lower than the figures above, estimated to be at 45%?