Download
1 / 3
30 likes | 203 Vues
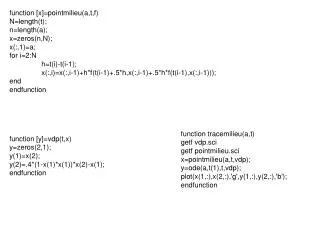
function [x]=pointmilieu(a,t,f) N=length(t); n=length(a); x=zeros(n,N); x(:,1)=a; for i=2:N h=t(i)-t(i-1); x(:,i)=x(:,i-1)+h*f(t(i-1)+.5*h,x(:,i-1)+.5*h*f(t(i-1),x(:,i-1))); end endfunction. function tracemilieu(a,t) getf vdp.sci getf pointmilieu.sci x=pointmilieu(a,t,vdp);

E N D
function [x]=pointmilieu(a,t,f) N=length(t); n=length(a); x=zeros(n,N); x(:,1)=a; for i=2:N h=t(i)-t(i-1); x(:,i)=x(:,i-1)+h*f(t(i-1)+.5*h,x(:,i-1)+.5*h*f(t(i-1),x(:,i-1))); end endfunction function tracemilieu(a,t) getf vdp.sci getf pointmilieu.sci x=pointmilieu(a,t,vdp); y=ode(a,t(1),t,vdp); plot(x(1,:),x(2,:),'g',y(1,:),y(2,:),'b'); endfunction function [y]=vdp(t,x) y=zeros(2,1); y(1)=x(2); y(2)=.4*(1-x(1)*x(1))*x(2)-x(1); endfunction
function traceRK4(a,t) getf RK4.sci getf vdp.sci x=RK4(a,t,vdp); y=ode(a,t(1),t,vdp); plot(x(1,:),x(2,:),'g',y(1,:),y(2,:),'b'); endfunction function [x]=RK4(a,t,f) N=length(t); n=length(a); x=zeros(n,N); x(:,1)=a; for i=2:N h=t(i)-t(i-1); k0=h*f(t(i-1),x(:,i-1)); k1=h*f(t(i-1)+.5*h,x(:,i-1)+k0*.5); k2=h*f(t(i-1)+.5*h,x(:,i-1)+k1*.5); k3=h*f(t(i-1)+h,x(:,i-1)+k2); x(:,i)=x(:,i-1)+(k0+2*k1+2*k2+k3)/6; end endfunction
function [x] = bashforth(x0,x1,t0,t1,N,f) n=length(x0); t=linspace(t0,t1,N); x=zeros(n,N); x(:,1)=x0; x(:,2)=x1; for i=3:N h=t(i)-t(i-1) x(:,i)=x(:,i-1)+ h*(3*f(t(i-1),x(i-1))-f(t(i-2),x(i-2)))/2; end endfunction function tracebash(x0,t) getf bashforth.sci getf vdp.sci N=length(t); t0=t(1); t1=t(N); h0=t(2)-t(1); x1=x0+h0*vdp(t(1)+.5*h0,x0+.5*h0*vdp(t(1),x0)); x=bashforth(x0,x1,t0,t1,N,vdp); y=ode(a,t(1),t,vdp); plot(x(1,:),x(2,:),'g',y(1,:),y(2,:),'b'); endfunction