Understanding Ecosystems: Energy Flow and Chemical Cycling
This chapter explores the concept of ecosystems, detailing the interactions between living organisms and their abiotic environment. It explains how energy flows through ecosystems while nutrients cycle within them. Key terms such as primary productivity, gross and net primary productivity, and trophic levels are discussed. The text illustrates how energy is partitioned at each trophic level and introduces the "Pyramid of Net Production," demonstrating the efficiency of energy transfer in ecosystems. Understanding these dynamics is crucial for studying ecological balance and sustainability.

Understanding Ecosystems: Energy Flow and Chemical Cycling
E N D
Presentation Transcript
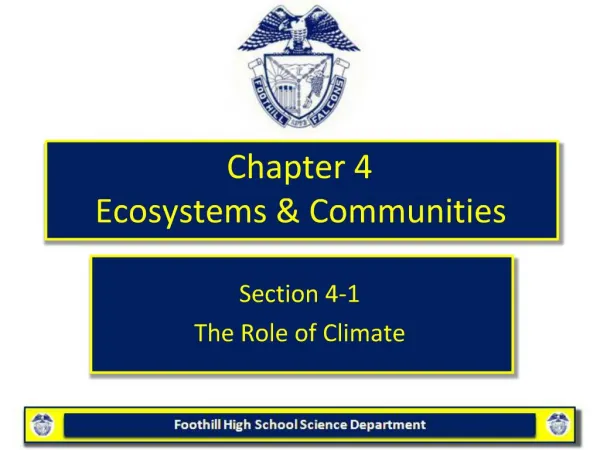
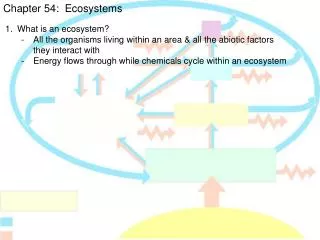
Chapter 54: Ecosystems • What is an ecosystem? • All the organisms living within an area & all the abiotic factors • they interact with • Energy flows through while chemicals cycle within an ecosystem
Tertiary consumers Microorganisms and other detritivores Secondary consumers Detritus Primary consumers Primary producers Heat Key Chemical cycling Sun Energy flow Figure 54.2 An overview of energy and nutrient dynamics in an ecosystem
Chapter 54: Ecosystems • What is an ecosystem? • All the organisms living within an area & all the abiotic factors • they interact with • Energy flows through while chemicals cycle within an ecosystem • What is primary productivity? • Amount of light energy converted to chemical energy by autotrophs • What is the difference between Gross PP & Net PP? • GPP = total primary productivity • Amount of light energy converted to chemical energy • by photosynthesis • NPP = GPP – respiration (energy used by organisms) • Storage of chemical energy available to consumers
125 Open ocean 360 Continental shelf 5.2 5.6 1,500 Estuary 0.3 1.2 2,500 0.1 Algal beds and reefs 0.9 0.1 Upwelling zones 500 0.1 3.0 4.7 0.04 Extreme desert, rock, sand, ice 0.9 90 3.5 Desert and semidesert scrub 2,200 22 3.3 Tropical rain forest 2.9 900 7.9 Savanna 9.1 2.7 600 Cultivated land 9.6 Boreal forest (taiga) 2.4 800 1.8 600 5.4 Temperate grassland 700 1.7 Woodland and shrubland 3.5 0.6 1.6 140 Tundra 1,600 7.1 1.5 Tropical seasonal forest Temperate deciduous forest 1,200 1.3 4.9 1,300 1.0 3.8 Temperate evergreen forest 0.4 2,000 Swamp and marsh 2.3 0.4 Lake and stream 250 0.3 0 10 20 30 40 50 60 0 500 1,000 1,500 2,000 2,500 0 5 10 15 20 25 Key (a) Percentage of Earth’ssurface area (b) Average net primaryproduction (g/m2/yr) (c) Percentage of Earth’s netprimary production Marine Terrestrial Freshwater (on continents) Figure 54.4 Net primary production of different ecosystems 65.0 24.4 Earth’s surface = 70% H2O
North Pole 60N 30N Equator 30S 60S South Pole 120W 180 180 0 60E 120E 60W Figure 54.5 Regional annual net primary production for Earth
Chapter 54: Ecosystems • What is an ecosystem? • All the organisms living within an area & all the abiotic factors • they interact with • Energy flows through while chemicals cycle within an ecosystem • What is primary productivity? • Amount of light energy converted to chemical energy by autotrophs • What is the difference between Gross PP & Net PP? • GPP = total primary productivity • Amount of light energy converted to chemical energy • by photosynthesis • NPP = GPP – respiration (energy used by organisms) • Storage of chemical energy available to consumers • What happens to energy at each trophic level?
Plant material eaten by caterpillar 200 J Cellular respiration 67 J 100 J Feces 33 J Growth (new biomass) Figure 54.10 Energy partitioning within a link of the food chain
Chapter 54: Ecosystems • What is an ecosystem? • All the organisms living within an area & all the abiotic factors • they interact with • Energy flows through while chemicals cycle within an ecosystem • What is primary productivity? • Amount of light energy converted to chemical energy by autotrophs • What is the difference between Gross PP & Net PP? • GPP = total primary productivity • Amount of light energy converted to chemical energy • by photosynthesis • NPP = GPP – respiration (energy used by organisms) • Storage of chemical energy available to consumers • What happens to energy at each trophic level? • 5. What does the “Pyramid of Net Production” look like?
Tertiary consumers 10 J Secondary consumers 100 J Primary consumers 1,000 J Primary producers 10,000 J 1,000,000 J of sunlight Figure 54.11 An idealized pyramid of net production - <1% harnessed by autotrophs Rule of 10 = only 10% of energy reaches the next trophic level Leads to the “Pyramid of Biomass”…..
Dry weight (g/m2) Trophic level 21 Primary consumers (zooplankton) Primary producers (phytoplankton) 4 (b) In some aquatic ecosystems, such as the English Channel, a small standing crop of primary producers (phytoplankton)supports a larger standing crop of primary consumers (zooplankton). Figure 54.12 Pyramids of biomass (standing crop) Dry weight (g/m2) Trophic level Tertiary consumers 1.5 Secondary consumers 11 37 Primary consumers Primary producers 809 (a) Most biomass pyramids show a sharp decrease in biomass at successively higher trophic levels, as illustrated by data froma bog at Silver Springs, Florida. Pyramids of net productivity & biomass give rise to…..”pyramid of numbers”
Trophic level Number of individual organisms Tertiary consumers 3 Secondary consumers 354,904 Primary consumers 708,624 Primary producers 5,842,424 Figure 54.13 A pyramid of numbers
Trophic level Secondary consumers Primary consumers Primary producers Fig. 54.14 Relative food energy available to the human population at different trophic levels - more energy is available to vegetarians than carnivores
Chapter 54: Ecosystems • What is an ecosystem? • All the organisms living within an area & all the abiotic factors • they interact with • Energy flows through while chemicals cycle within an ecosystem • What is primary productivity? • Amount of light energy converted to chemical energy by autotrophs • What is the difference between Gross PP & Net PP? • GPP = total primary productivity • Amount of light energy converted to chemical energy • by photosynthesis • NPP = GPP – respiration (energy used by organisms) • Storage of chemical energy available to consumers • What happens to energy at each trophic level? • What does the “Pyramid of Net Production” look like? • Let’s consider chemical cycling within an ecosystem….
THE CARBON CYCLE THE WATER CYCLE CO2 in atmosphere Transport over land Photosynthesis Solar energy Cellular respiration Net movement of water vapor by wind Precipitation over land Precipitation over ocean Evaporation from ocean Burning of fossil fuels and wood Evapotranspiration from land Higher-level consumers Primary consumers Percolation through soil Carbon compounds in water Detritus Runoff and groundwater Decomposition Figure 54.17 Nutrient Cycles
THE PHOSPHORUS CYCLE THE NITROGEN CYCLE N2 in atmosphere Rain Plants Weathering of rocks Geologic uplift Runoff Assimilation Denitrifying bacteria Consumption NO3 Sedimentation Nitrogen-fixing bacteria in root nodules of legumes Plant uptake of PO43 Decomposers Nitrifying bacteria Soil Nitrification Leaching Ammonification NO2 NH3 NH4+ Nitrogen-fixing soil bacteria Nitrifying bacteria Decomposition
Chapter 54: Ecosystems • What is an ecosystem? • What is primary productivity? • What is the difference between Gross PP & Net PP? • What happens to energy at each trophic level? • What does the “Pyramid of Net Production” look like? • Let’s consider chemical cycling within an ecosystem…. • What happened at the Hubbard Brooks Experimental Forest? • - Nutrients stayed within an ecosystem due to plants
(a) Concrete dams and weirs built across streams at the bottom of watersheds enabled researchers to monitor the outflow of water and nutrients from the ecosystem. (b) One watershed was clear cut to study the effects of the loss of vegetation on drainage and nutrient cycling. Deforested 80.0 (c) The concentration of nitrate in runoff from the deforested watershed was 60 times greater than in a control (unlogged) watershed. 60.0 40.0 20.0 Nitrate concentration in runoff (mg/L) Completion of tree cutting 4.0 Control 3.0 2.0 1.0 0 1967 1965 1966 1968 Figure 54.19 Nutrient cycling in the Hubbard Brook Experimental Forest: an example of long-term ecological research
Chapter 54: Ecosystems • What is an ecosystem? • What is primary productivity? • What is the difference between Gross PP & Net PP? • What happens to energy at each trophic level? • What does the “Pyramid of Net Production” look like? • Let’s consider chemical cycling within an ecosystem…. • What happened at the Hubbard Brooks Experimental Forest? • Nutrients stayed within an ecosystem due to plants • What is biological magnification? • - Concentration of toxins increase in higher trophic levels
Herring gull eggs 124 ppm Lake trout 4.83 ppm Concentration of PCBs Smelt 1.04 ppm Zooplankton 0.123 ppm Phytoplankton 0.025 ppm Fig. 54.23 Biological magnification of PCBs in a Great Lakes food web