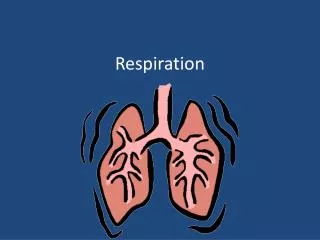
Respiration
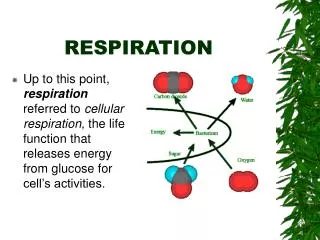
This detailed guide explores the intricate processes of sucrose metabolism, emphasizing glycolysis and aerobic respiration within cellular respiration. It breaks down the anaerobic phase occurring in the cytoplasm, detailing glycolysis with net production of 4 ATP and 4 NADH. The aerobic phase in the mitochondria features the Krebs Cycle and its contributions to energy output, culminating in the total energy yield from sucrose. With analytic insight into 76 ATP produced per sucrose molecule, this overview enhances understanding of metabolic pathways.

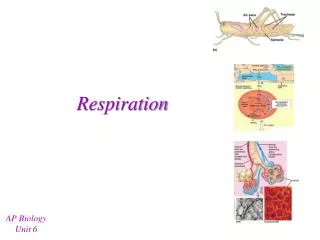
Respiration
E N D
Presentation Transcript
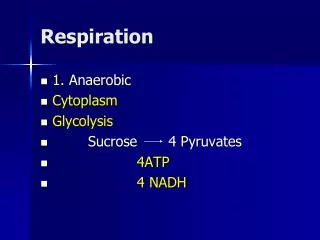
Respiration • 1. Anaerobic • Cytoplasm • Glycolysis • Sucrose 4 Pyruvates • 4ATP • 4 NADH
Respiration • 2. Aerobic • Mitochondria • Krebs Cycle (Citric Acid or TCA Cycle) • 4 Pyr ---> 12 CO2 • 4 ATP • 16 NADH • 4 FADH
Respiration • 3. Total (1+2) • Sucrose ---> 12 CO2 • 8 ATP • 20 NADH = 60 ATP • 4 FADH = 8 ATP • ________________ • 76 ATP for every Sucrose
Glycolysis • Sucrose (12C) Glucose (6C) + Fructose (6C) Invertase - ATP • Glucose G-6-P - ATP • Fructose F-6-P • G-6-P F-6-P (2 x 6C) • -2 ATP (Energy Requirement)
Glycolysis -2 ATP • 2 F-6-P 2 F-1,6 bisP • 2 F1,6bisP 4 PGAL • + 4 NADH • + 4 Pi • 4 PGAL 4 1,3-diPGA • + 4 ATP • 4 1,3 diPGA 4 PGA • Net = 4 NADH
Glycolysis • 4 PGA 4 PEP C4 & CAM + 4 ATP - CO2 • 4 PEP 4 PYR Ethanol (2C) -O2 + O2 Mitochondria 4 x (3 C) = 12 C Net = + 4 NADH + 4 ATP
Glycolysis Sucrose 12 C 2 x 6 C 2 x 6 C 4 x 3 C Pyruvate
Krebs Cycle • 4 PYR 12 CO2 • + 4 NADH • + 1 FADH • + 4 ATP
Energy Recovery • GLYCOLYSISKREBSTOTAL • ATP 4 4 8 • NADH 4 16 20 • FADH 0 4 4
Final Products • Sucrose • 12 CO2 TCA from Sucrose • - 6 O2 Electron Transport • - 24 H+ NADH +FADH • 12 H2O Electron Transport • 68 ATP Electron Transport • 8 ATP TCA + Glycolysis • 76 ATP • 8 Cal / ATP • 608 Cal / mole of Sucrose