Download
1 / 25
290 likes | 486 Vues
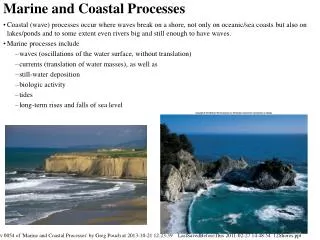
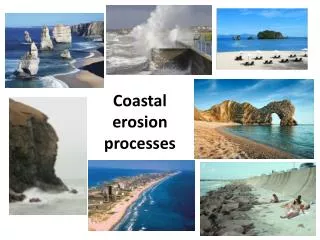
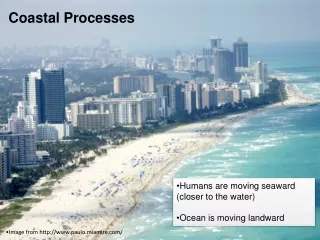
Coastal Processes and Observations. What is a beach?. Different things to different people Strip of unconsolidated material, the shape of which is dependent on: Wave and tidal energy Quality and quantity of sediment supply Respond with great sensitivity to the forces that act on it Wind

E N D
What is a beach? • Different things to different people • Strip of unconsolidated material, the shape of which is dependent on: • Wave and tidal energy • Quality and quantity of sediment supply • Respond with great sensitivity to the forces that act on it • Wind • Waves • Currents • Acts as a buffer – retreats when things are rough and returns when things calm down. Shapes itself to best absorb the amount of energy in the waves.
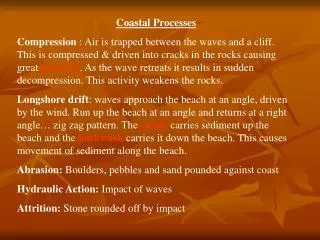
Driving force behind most coastal processes Locally, most common are wind driven waves – initiated by wind shear Wave height is determined by Speed Duration Fetch – distance a wave travels Waves
Wave Anatomy • Per Wave length – in meters Wave Period – Time it take for one complete wave cycle to pass a reference point (sec-1) Wave Frequency – Number of cycles that pass an observer in a given time
Shallow Water Waves • Waves that can feel the bottom – affects the oscillatory motion of the wave particle – begins when depth(z) is half of the wave length (L) • Velocity slows because of drag • Period remains the same • Length decreases • Height increases – wave moves faster at the crest, crest overtakes the trough. When the crest is no longer supported, the wave breaks. Once the wave breaks, particles no longer move in oscilatory motion.
Wave Animation • Particles travel in clockwise circles • The radius of the circles decreases as the depth into the water increases.
Results of Waves • Slope of the beach face • Product of the interaction of swash and backwash • High energy – steep slope, sand being removed • Low energy – shallow slope, sand being added • May be seasonal • Long Shore drift • Mostly responsible for movement of sand • Waves striking at an angle forces surf zone water to move laterally • Breaking waves suspend the sand, LS drift moves it
Low Energy Beach High Energy
Calculations Wave speed (c): • Acceleration due to gravity (g) = 9.8 m/sec2 • Water Depth (z) Power of Longshore Transport: • Density of seawater (ρ) = 1015 kg/m3 • Angle of the wave to the beach (α) • Power of longshore transport (P1) • Wave Height (H) C=√gz P1 = c (⅛ ρ g H2) sinα cos α
Rate of Sediment Movement • Density of the sediment (σ) = 2650 kg/m3 • Coefficient relating to loss of water due to percolation through sediment = 0.77 • Coefficient related to the packing of the individual grains = 0.6 • Longshore rate of sediment movement for sand in m3sec-1 (qs) qs= 0.77 P1/(σ – ρ)g 0.6
Littoral Environmental Observations Simple beach observations and measurements that, if taken over a long period of time, may be used to model coastal erosion and deposition. • Pre-designed data forms to simplify data input and make sure all data are collected • A lot of information can be gathered in a short period of time that gives a relatively sophisticated picture of what is happening
Redundancy on Data forms – QC • Wave Period (meter stick) • 11 crests = 10 wave lengths • Normalize data • Breaker Height (meter stick) • Distance between crest and trough, not bottom • Estimation • Convert inches to ft • Wind speed • Anemometer • Foreshore Slope • inclinometer • Width of surf zone • Where waves start to peak up to where they break
Dumping WavesDumping or Plunging waves break with a tremendous force and can throw a swimmer to the bottom. They usually occur at low tide, when the sand banks are shallow and there is less water for the waves to break onto. • Surging Surging waves may never actually break as they approach the waters edge, as a result of the water being very deep beneath them. They do not lose speed or gain height. • Spilling Spilling waves occur when the crest (top) of the wave tumbles down the face (front) of the wave. As the tide gets lower and the sandbank on which the waves are breaking becomes shallower, this type of wave will form tunnels or 'tubes'.
Precision vs Accuracy • Precision refers to the degree of specified detail which can be observed or closeness of repeated measurements to each other. • Accuracy refers to the truthfulness, or correctness, of the specified data or the closeness of a measured or derived data value to its true value. For instance a balance with a fault can give bias could give precise (ie very repeatable) but inaccurate (ie untrue) results. One desperately needs the other!
Most common method for drawing the cross section of a beach utilizes a surveyor’s level and leveling rod Vertical elevations are often referenced to the NGVD (National Geodetic Vertical Datum) Based on mean sea level in 1926 at 26 tidal benchmarks along 3 US coats Beach Surveys
Take Home Concepts • Lots of ways to approach a problem • Choosing the right tool for the job • Instruments • Data Sheet design • Build in QA/QC • Normalization of data • Volunteer programs – helpful or hassel? • Precision vs Accuracy
notes • Calculate power of longshore transport (given equations and constants but must know what goes where and how to solve) • Wave anatomy and how it changes with changing parameters • Accuracy and precision