Download
1 / 66
670 likes | 806 Vues
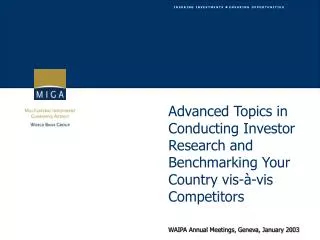
I N S U R I N G I N V E S T M E N T S E N S U R I N G O P P O R T U N I T I E S. Advanced Topics in Conducting Investor Research and Benchmarking Your Country vis-à-vis Competitors WAIPA Annual Meetings, Geneva, January 2003. Outline. Introduction

E N D
I N S U R I N G I N V E S T M E N T S E N S U R I N G O P P O R T U N I T I E S Advanced Topics in Conducting Investor Research and Benchmarking Your Country vis-à-vis Competitors WAIPA Annual Meetings, Geneva, January 2003
Outline • Introduction • Benchmarking Your Country vis-à-vis Competitors – MIGA’s Experience in South East Asia • Exploiting Trade Privileges to Attract Export-Oriented FDI • Sector Research • Company Research Resources • Wrap-Up Discussion
Research for Targeting Sectors and Companies Broad Sector Opportunities SWOT/Benchmarking Sector Selection Process Company Selection Process Target Companies
Research for Targeting Sectors and Companies Broad Sector Opportunities SWOT/Benchmarking Sector Selection Process Company Selection Process Target Companies
MIGA’s Benchmarking Project in SE ASIA WHO ARE WE BENCHMARKING?
MIGA’s Benchmarking Project in SE ASIA WHO ARE WE BENCHMARKING? CHINA
MIGA’s Benchmarking Project in SE ASIA WHO ARE WE BENCHMARKING? CHINA VIET NAM
MIGA’s Benchmarking Project in SE ASIA WHO ARE WE BENCHMARKING? CHINA VIET NAM THAILAND
MIGA’s Benchmarking Project in SE ASIA WHO ARE WE BENCHMARKING? CHINA VIET NAM THAILAND MALAYSIA
MIGA’s Benchmarking Project in SE ASIA WHO ARE WE BENCHMARKING? CHINA VIET NAM THAILAND MALAYSIA INDONESIA
MIGA’s Benchmarking Project in SE ASIA WHO ARE WE BENCHMARKING? CHINA VIET NAM THAILAND MALAYSIA INDONESIA PHILIPPINES
MIGA’s Benchmarking Project in SE ASIA WHAT ARE WE BENCHMARKING? CHINA VIET NAM THAILAND MALAYSIA INDONESIA PHILIPPINES ELECTRONIC PARTS MFG.
MIGA’s Benchmarking Project in SE ASIA WHAT ARE WE BENCHMARKING? CHINA VIET NAM THAILAND MALAYSIA INDONESIA PHILIPPINES ELECTRONIC PARTS MFG. CALL CENTER / SHARED SERVICE CENTER
MIGA’s Benchmarking Project in SE ASIA WHAT ARE WE BENCHMARKING? COSTS VARIABLE COSTS Utilities Labor Taxes Real Estate (Lease) FIXED COSTS Real Estate (Buy or Construct) (Not Benchmarked in the Study) ONE-TIME RELOCATION COSTS Machinery & Equipment Import Costs Ex-Pat Relocation OTHER COSTS Logistic Costs Training Costs Mitigation / Permitting / (Soft) Costs
MIGA’s Benchmarking Project in SE ASIA WHAT ARE WE BENCHMARKING? CONDITIONS • Labor: • Productivity • Availability • Skill Levels • Turnover • Reliability • Relations • Logistics: • Port Access • Air Access • Rail Access • Truck Access • QOL: • Housing • Schools • Recreation • Safety • Environment • Utilities: • Access • Reliability • Real Estate: • Availability • Condition • Market Trends • Terms • Depreciation • Market: • Political • Social • Legal • Financial • Regulatory • Geographical • Risk • Services: • Suppliers • Customs • Accounting • Legal • Financial • Distributors • Demographics: • Unions • Industry • Presence • Population • Trends • Employment • by Sectors • Etc.
LABOR COSTS BANGKOK KL HCMC HANOI JAKARTA MAKATII PUDONG BEIJING TOTAL COST $13,087,849 $13,976,914 $13,976,560 $13,976,560 $13,976,560 $13,095,909 $13,976,914 $13,976,560 ACCOUNTING CLERK III $6,968,270 $8,189,126 $8,176,605 $8,176,605 $8,176,605 $7,394,005 $8,189,126 $8,176,605 KEY ENTRY OPERATOR II $2,892,552 $2,940,101 $2,940,101 $2,940,101 $2,940,101 $3,058,973 $2,940,101 $2,940,101 GENERAL CLERK III $746,928 $952,224 $956,592 $956,592 $956,592 $898,061 $952,224 $956,592 GENERAL CLERK I $1,912,560 $1,326,000 $1,333,800 $1,333,800 $1,333,800 $1,229,280 $1,326,000 $1,333,800 DUPLI. MACH. OPERATOR II $400,608 $382,512 $382,512 $382,512 $382,512 $351,936 $382,512 $382,512 SECRETARY I $166,930 $186,950 $186,950 $186,950 $186,950 $163,654 $186,950 $186,950 Annual Labor Costs $12,000,000 $14,000,000 $10,000,000 $8,000,000 $6,000,000 $4,000,000 $2,000,000 $0 TOTAL COST ACCOUNTING CLERK III KEY ENTRY OPERATOR II BEIJING GENERAL CLERK III PUDONG GENERAL CLERK I MAKATI CITY JAKARTA DUPLI. MACH. OPERATOR II HANOI HCMC SECRETARY I KUALA LUMPUR BANGKOK MIGA BENCHMARKING MODEL HOW ARE WE BENCHMARKING?
COST PROFORMA Each Cost & Condition is Compared Labor Productivity Labor Availability $25.00 Labor Costs $20.00 $30.00 City 10 $15.00 City 9 City 8 $25.00 $10.00 City 7 City 6 City 5 $5.00 $20.00 City 4 City 3 $0.00 City 10 $15.00 City 1 City 9 City 8 $10.00 City 7 City 6 City 5 $5.00 City 4 City 3 $0.00 City 1 Various Labor Classifications MIGA BENCHMARKING MODEL HOW ARE WE BENCHMARKING?
COST PROFORMA MIGA BENCHMARKING MODEL HOW ARE WE BENCHMARKING?
Urban Population Growth Rate 100.00 90.00 80.00 70.00 60.00 50.00 40.00 30.00 20.00 BEIJING 10.00 MAKATI 0.00 1990 BANGKOK 1995 HCMC 2000 2005 2010 JAKARTA DEMOGRAPHICS MIGA BENCHMARKING MODEL HOW ARE WE BENCHMARKING?
Unemployment Rates 9.0% 8.0% 7.0% 6.0% 5.0% 4.0% 3.0% 2.0% 1.0% 0.0% 1990 1992 BEIJING MAKATI 1994 BANGKOK HCMC 1996 ECONOMICS JAKARTA MIGA BENCHMARKING MODEL HOW ARE WE BENCHMARKING?
Desk-Top Level Research Costs Conditions I.D. Sources Entry into Model Report Results Fieldwork Interviews Field Interviews (8-10 Foreign Investors) Fine-Tune Costs and Conditions Entry into Model Report Results HOW ARE WE BENCHMARKING? METHODOLOGY
WHY ARE WE BENCHMARKING? Fieldwork beyond Cost and Conditions Motivation for choosing particular country Principal evaluation factors (criteria) in decision What other countries were being considered Original expectations and needs been met What is on the horizon for the company (expansion, new greenfield, status-quo, leaving) What is the origin of their capital Where is their Parent Company located Where is the Site Selection decision made Where is the destination market of their product Where are their suppliers located What are the major obstacles encountered
WHY ARE WE BENCHMARKING? OUTPUT For the IPA: Benchmarking Methodology Industry Criteria Development Understand Industry / Sector Basis for SWOT Analysis Address Weaknesses Position vs. Competition Compare Desk-Top / Fieldwork Results Help Fill Information Gaps Feedback into Targeting / Marketing Efforts Promote Partnerships Promote Aftercare
Research for Targeting Sectors and Companies Broad Sector Opportunities SWOT/Benchmarking Sector Selection Process Company Selection Process Target Companies
Online Research for Selecting Priority Sectors SWOT Analysis/ Benchmarking Broad Sector Opportunities Sector Selection Process Company Selection Process Target Companies
Sector Targeting: Concrete Example • Using Trade Preferences • to Promote Investments • Targeting Study Undertaken • by ITC for MIGA-Swiss Partnership
Pilot Country Study Eastern and Western Africa Coastal and Land-Locked Africa Francophone and Anglophone Africa • Results Easily Replicated by Other Countries
Define Opportunities • Review Relevant Agreements: • AGOA, LOME/COTONOU, EBA • Regional Agreements: COMESA, EAC, SADC, ECOWAS, UEMOA, etc. • Define Implications at a 6-Digit HT Level
Table AG1: most important tariff reductions under AGOA, excluding textile & clothing
Table E1: most important tariff reductions for LDCs under EBA
Implementation • Compile Industry Opportunity Profiles • Identify investor countries • Identify potential investor companies • Undertake investor outreach missions • Follow up on investor interest • Facilitate inward missions • Investor facilitation • Investor servicing • Facilitate reinvestment • Facilitate local linkages
Research for Targeting Sectors and Companies Broad Sector Opportunities SWOT/Benchmarking Sector Selection Process Company Selection Process Target Companies
Online Research for Selecting Priority Sectors SWOT Analysis/ Benchmarking Broad Sector Opportunities Sector Selection Process Company Selection Process Target Companies
Sector Targeting: Example of Sector Analysis Using U.S. Economic Census Data • Industry Series – Reports (available for free in pdf format, downloadable from www.census.gov site) • Data from 1997 Census (2002 Census currently underway)
Understanding the Sector • Understanding international business trends • The forces affecting the way business is done in the target sector • Resulting in changes: • Structure of the Industry • Positioning or segmentation • Business models • Understanding Market trends and agreements • WTO framework and changes • North American Free Trade Agreement –(NAFTA) • ASEAN • South American Common Market - MERCOSUR • AGOA - Africa • Caribbean Basin Initiative - CBI 2 • EU
Understanding the Sector • Technology trends • Technological changes that affect the industry • Product substitutes • Product improvement • Miniaturization and robotization • New materials • Process improvement • Marketing and distribution changes • Eg. Internet/E-commerce/E-business • Fiber optics • Just in time production/sourcing
Understanding the Sector • Scale indicators • Number of investors • Employment • Number of workers • Workers per company • Sales per employee • Value added per worker • Characteristics of the sector • Percentage of employees in production? Other activities? • Measures degree of labor intensiveness • Average salaries per hour
2. Download Industry Series Report for Sub-Sector (in pdf) – Example: NAICS 315212
3. Statistical Data on Industry Size, Composition, Geographic Distribution – NAICS 315212
NAICS 315212 Geographic Distribution
Degree of Labor Intensiveness NAICS 315212
Level of Value Added NAICS 315212
Apparel – Sales by Sub-Sectors 2329 Men’s & Boy’s Clothing 2339 Women’s & Misses Outerwear