Chapter 6 Probability
Chapter 6 Probability. PowerPoint Lecture Slides Essentials of Statistics for the Behavioral Sciences Seventh Edition by Frederick J. Gravetter and Larry B. Wallnau. Chapter 6 Learning Outcomes. Concepts to review. Proportions (Math Review, Appendix A) Fractions Decimals Percentages

Chapter 6 Probability
E N D
Presentation Transcript
Chapter 6Probability PowerPoint Lecture SlidesEssentials of Statistics for the Behavioral SciencesSeventh Editionby Frederick J. Gravetter and Larry B. Wallnau
Concepts to review • Proportions (Math Review, Appendix A) • Fractions • Decimals • Percentages • Basic algebra (Math Review, Appendix A) • Upper and lower real limits (Chapters1 & 2) • z-scores (Chapter 5)
6.1 Introduction to Probability • Research begins with a question about an entire population. • Actual research is conducted using a sample. • Inferential statistics use sample data to answer questions about the population • Relationships between samples and populations are defined in terms of probability
Figure 6.1 Role of probability in inferential statistics
Definition of Probability • Several different outcomes are possible • The probability of any specific outcome is a fraction or proportion of all possible outcomes
Definition of Random Sample • Each individual in the population has an equal chance of being selected • Probabilities must stay constant from one selection to the next if more than one individual is selected
Probability and Frequency Distributions • Probability usually involves population of scores that can be displayed in a frequency distribution graph • Different portions of the graph represent portions of the population • Proportions and probabilities are equivalent • A particular portion of the graph corresponds to a particular probability in the population
Figure 6.2 Population frequency distribution histogram
Learning Check • A deck of cards contains 12 royalty cards.If you randomly select a card from the deck, what is the probability of obtaining a royalty card?
Learning Check - Answer • A deck of cards contains 12 royalty cards.If you randomly select a card from the deck, what is the probability of obtaining a royalty card?
Learning Check TF • Decide if each of the following statements is True or False.
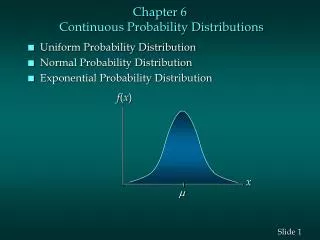
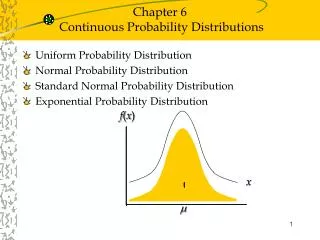
6.2 Probability and the Normal Distribution • Normal distribution is a common shape • Symmetrical • Highest frequency in the middle • Frequencies taper off towards the extremes • Defined by an equation • Can be described by the proportions of area contained in each section. • z-scores are used to identify sections
Traits of the normal distribution • Sections on the left side of the distribution have the same area as corresponding sections on the right • Because z-scores define the sections, the proportions of area apply to any normal distribution • Regardless of the mean • Regardless of the standard deviation
The Unit Normal Table • The proportion for only a few z-scores can be shown graphically • The complete listing of z-scores and proportions is provided in the unit normal table • Complete Unit Normal Table is in Appendix B, Table B.1
Probabilities, Proportions, z-Scores • Unit normal table lists relationships between z-score locations and proportions in a normal distribution. • If you know the z-score, you can look up the corresponding proportion. • If you know the proportions, you can use the table to find the specific z-score location. • Probability is equivalent to proportions.
Learning Check • Find the proportion of the normal curve that corresponds to z > 1.50
Learning Check - Answer • Find the proportion of the normal curve that corresponds to z > 1.50
Learning Check • Decide if each of the following statements is True or False.
6.3 Probabilities and proportions for scores from a normal distribution • The Unit Normal Table can only be used with normal-shaped distributions; the shape of the distribution should be verified. • For normal-shaped distributions • Transform the X values into z-scores • Look up the proportions corresponding to the z-score values.
Box 6.1 Percentile ranks • Percentile rank is the percentage of individuals in the distribution who have scores that are less than or equal to the specific score. • Probability questions can be rephrased as percentile rank questions.
Figure 6.12 Determining probabilities or proportions for a normal distribution
Learning Check • Membership in MENSA requires a score of 130 on the Stanford-Binet 5 IQ test, which has μ = 100 and σ = 15. What proportion of the population qualifies for MENSA?
Learning Check - Answer • Membership in MENSA requires a score of 130 on the Stanford-Binet 5 IQ test, which has μ = 100 and σ = 15. What proportion of the population qualifies for MENSA?
Learning Check • Decide if each of the following statements is True or False.
6.4 Looking ahead to inferential statistics • Many research situations begin with a population that forms a normal distribution. • A random sample is selected and receives a treatment, to evaluate the treatment. • Probability is used to decide whether the treated sample is “noticeably different” from the population.