Database performance
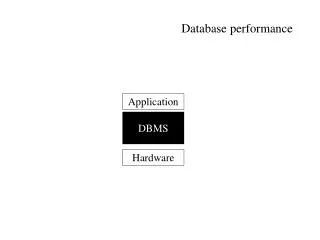
Database performance. Application. DBMS. Hardware. Conclusions WISC & AS3AP. Observation: Database system performance differ widely A benchmark suite is a collection of database tasks which should have a precisely articulated goal should be minimal should be scalable

Database performance
E N D
Presentation Transcript
Database performance Application DBMS Hardware
Conclusions WISC & AS3AP Observation: Database system performance differ widely A benchmark suite is a collection of database tasks which • should have a precisely articulated goal • should be minimal • should be scalable • should have an associated metric
Commonly used performance measures: Response time (delay from submission of transaction to return of result) Throughput (transactions per second, or tps) Availability or mean time to failure Speedup (linear->twice as much resources reduces time half) Scaleup (response time remains constant with increasing load and resources) Sizeup (doubling the size does not double required resources) Performance Benchmarks
Beware when computing average throughput of different transaction types E.g., suppose a system runs transaction type A at 99 tps and transaction type B at 1 tps. Given an equal mixture of types A and B, throughput is not (99+1)/2 = 50 tps. Running one transaction of each type takes time 1+.01 seconds, giving a throughput of 1.98 tps (= 2/1.01). Interference (e.g. lock contention) makes even this incorrect if different transaction types run concurrently Performance Benchmarks (Cont.)
Metric Selections • Arithmetic mean • Geometric mean • Harmonic mean
Metric Selections • Arithmetic mean • Geometric mean
Metric Selections • Geometric mean • Move away from zero to “level” impact
Metric Selections • Criteria • Easy to explain in mathematical terms to users • Non-hypersensitivity • Scalability translates to easy change of metric • Balance to capture delta changes in outlier positions • Easy translation to operational decisions • How to relate performance metric to an application field ?
Database Application Classes • Online transaction processing (OLTP) • requires high concurrency and clever techniques to speed up commit processing, to support a high rate of update transactions. • Decision support applications • including online analytical processing, or OLAP applications, require good query evaluation algorithms and query optimization. • Embedded applications • Requires small footprint, small database storage
The Transaction Processing Council (www.tpc.org) benchmark suites are widely used. TPC-A and TPC-B: simple OLTP application modeling a bank teller application with and without communication Not used anymore TPC-C: complex OLTP application modeling an inventory system Current standard for OLTP benchmarking Benchmarks Suites
Benchmarks Suites (Cont.) • TPC benchmarks (cont.) • TPC-D: complex decision support application • Superceded by TPC-H and TPC-R • TPC-H: (H for ad hoc) • Models ad hoc queries which are not known beforehand • Total of 22 queries with emphasis on aggregation • prohibits materialized views • permits indices only on primary and foreign keys • TPC-R: (R for reporting) same as TPC-H, but without any restrictions on materialized views and indices • TPC-W: (W for Web) End-to-end Web service benchmark modeling a Web bookstore, with combination of static and dynamically generated pages
TPC performance measures transactions-per-second with specified constraints on response time transactions-per-second-per-dollar accounts for cost of owning system TPC benchmark requires database sizes to be scaled up with increasing transactions-per-second reflects real world applications where more customers means more database size and more transactions-per-second External audit of TPC performance numbers mandatory TPC performance claims can be trusted TPC Performance Measures
TPC Performance Measures • Two types of tests for TPC-H and TPC-R • Power test: runs queries and updates sequentially, then takes mean to find queries per hour • Throughput test: runs queries and updates concurrently • multiple streams running in parallel each generates queries, with one parallel update stream • Composite query per hour metric: square root of product of power and throughput metrics • Composite price/performance metric
Other Benchmarks • Mysql, SQLite, contain (test) benchmarks • Benchmarks for XML e.g Xmark • http://www.xml-benchmark.org • Invent your own benchmark to understand a portion of the system behavior
Benchmark Blackholes • Areas for (practical) research • System components, e.g.view maintenance and optimizer stability • Conformancy tests for language standards • Scalable catalog management • Confined resource performance, e.g. running on an embedded device. • Using MonetDB’s storage model on traditional systems.
We need Tweety.sql ! Canary monitoring • GOAL: give a warning if the system is reaching it limits in terms of user-responsiveness, either due to unexpected load or reaching resource limits.
Canary monitoring • GOAL: give a warning if the system is reaching it limits in terms of user-responsiveness, either due to unexpected load or reaching resource limits. • Rules: • Don’t use functions outside the realm of SQL • It should run within a few seconds on lightly loaded system • As little intrusion as possible to others
Canary monitoring • Solution: it should touch all the components of the system, while still not being resource intensive. • Database construction and population • DBtapestry 100k x 2 = 1Mb • Transactional update/abort • 4-way joins, arithmetic and output • (Clustered-)Index management • Bulk update
Its first steps in a cruel world Too high variance
Running a single 1Mx32 DBtapestry experiment
Switch to SQLcmd Tweety.sql died after 70 hrs, probably caused by SqlWb limitations The query has exceeded the maximum number of result sets that can be displayed in the results grid. Only the first 100 result sets are displayed in the grid.
Webbrowsing and email whole morning On the phone for a long time Back from Microsoft shop To Microsoft shop
What was running? • 2x Excell • 2x Powerpoint • 3x IE • 1x Outlook • 1x Performance tool • 1x SQLcmd • 1x Thunderbird mailer • 1x SQLWb • 1x Putty • 1x Filezilla • 1x Folder
Database systems and database applications tend to perform sub-optimal. Learning how and where to look for improvements is essential. It may improve performance with a 10-fold easily. Performance tuning is adjusting various parameters and design choices to improve system performance for a specific application. Tuning is best done by identifying bottlenecks, and eliminating them. Performance Tuning
Can tune a database system at 3 levels: Hardware -- e.g., add disks to speed up I/O, add memory to increase buffer hits, move to a faster processor. Database system parameters -- e.g., set buffer size to avoid paging of buffer, set check pointing intervals to limit log size. Higher level database design, such as the schema, indices and transactions (more later) Performance Tuning
Bottlenecks • Performance of most systems (at least before they are tuned) usually limited by performance of one or a few components: these are called bottlenecks • E.g. 80% of the code may take up 20% of time and 20% of code takes up 80% of time • Worth spending most time on 20% of code that take 80% of time • Removing one bottleneck often exposes another • De-bottlenecking consists of repeatedly finding bottlenecks, and removing them • This is a heuristic
Transactions request a sequence of services, e.g. CPU, Disk I/O, locks With concurrent transactions, transactions may have to wait for a requested service while other transactions are being served Research issue: Can we model database behavior as a queueing system with a queue for each service ?? request a service, wait in queue for the service, and get serviced Queuing simulation does not precisely predict overall behavior unless the you have long running transactions, because then it reduces the error rate and disturbance by the experimentation setting. Identifying Bottlenecks
Bottlenecks in a database system typically show up as very high utilizations (and correspondingly, very long queues) of a particular service E.g. disk vs CPU utilization 100% utilization leads to very long waiting time: Rule of thumb: design system for about 70% utilization at peak load utilization over 90% should be avoided Ill-balanced resource allocation in the underlying operating system Identifying Bottlenecks
Tunable Parameters • Tuning of hardware • Tuning of algorithms • Tuning of schema • Tuning of indices • Tuning of materialized views • Tuning of transactions
Tuning of Hardware • Even well-tuned transactions typically require a few I/O operations • Typical disk supports about 100 random I/O operations per second • Suppose each transaction requires just 2 random I/O operations. • Then to support n transactions per second, we need to stripe data across n/50 disks (ignoring skew) • Number of I/O operations per transaction can be reduced by keeping more data in memory • If all data is in memory, I/O needed only for writes • Keeping frequently used data in memory reduces disk accesses, reducing number of disks required, but has a memory cost
RAID Levels • RAID Level 1: Mirrored disks with block striping • Offers best write performance. • Popular for applications such as storing log files in a database system.
RAID Levels (Cont.) • RAID Level 5: Block-Interleaved Distributed Parity; partitions data and parity among all N + 1 disks, rather than storing data in N disks and parity in 1 disk. • E.g., with 5 disks, parity block for nth set of blocks is stored on disk (n mod 5) + 1, with the data blocks stored on the other 4 disks. • Before writing a block, parity data must be computed • Can be done by using old parity block, old value of current block and new value of current block (2 block reads + 2 block writes)
Hardware Tuning: Choice of RAID Level • To use RAID 1 or RAID 5? • Depends on ratio of reads and writes • RAID 5 requires 2 block reads and 2 block writes to write out one data block • If an application requires K reads and L writes per second • RAID 1 requires K + 2L I/O operations per second • RAID 5 requires: K + 4L I/O operations per second
Hardware Tuning: Choice of RAID Level • For reasonably large r and w, this requires lots of disks to handle workload • RAID 5 may require more disks than RAID 1 to handle load! • Apparent saving of number of disks by RAID 5 (by using parity, as opposed to the mirroring done by RAID 1) may be illusory! • Thumb rule: RAID 5 is fine when writes are rare and data is very large, but RAID 1 is preferable otherwise • If you need more disks to handle I/O load, just mirror them since disk capacities these days are enormous!
Question: which data to keep in memory: • If a page is accessed n times per second, keeping it in memory saves • n * price-per-disk-drive accesses-per-second-per-disk • Cost of keeping page in memory • price-per-MB-of-memory pages-per-MB-of-memory • Break-even point: value of n for which above costs are equal • If accesses are more then saving is greater than cost • Solving above equation with current disk and memory prices leads to: 5-minute rule:if a page that is randomly accessed is used more frequently than once in 5 minutes it should be kept in memory
Hardware Tuning: One-Minute Rule • For sequentially accessed data, more pages can be read per second. Assuming sequential reads of 1MB of data at a time: 1-minute rule: sequentially accessed data that is accessed once or more in a minute should be kept in memory • Prices of disk and memory have changed greatly over the years, but the ratios have not changed much • Sequential bandwidth can grow to ca 1Gb second
Tuning of algorithms • Data structures often expose hotspots • The root of a B-tree • The front of a message queue • The log file • Value encoding • Hotspot detection is difficult for end-users and impossible to resolve directly • Open source not necessary helps
Schema tuning Vertically partition relations to isolate the data that is accessed most often -- only fetch needed information. Improve performance by storing a denormalized relation E.g., store join of account and depositor; branch-name and balance information is repeated for each holder of an account, but join need not be computed repeatedly. better to use materialized views (more on this later..) Cluster together on the same disk page records that would match in a frequently required join, compute join very efficiently when required. Tuning the Database Design
Index tuning Create appropriate indices to speed up slow queries/updates Speed up slow updates by removing excess indices (tradeoff between queries and updates) Choose type of index (B-tree/hash) appropriate for most frequent types of queries. Choose which index to make clustered Index tuning wizards look at past history of queries and updates (the workload) and recommend which indices would be best for the workload Tuning the Database Design (Cont.)
Tuning the Database Design (Cont.) Materialized Views • Materialized views can help speed up certain queries • Particularly aggregate queries • Overheads • Space • Time for view maintenance • Immediate view maintenance:done as part of update txn • time overhead paid by update transaction • Deferred view maintenance: done only when required • update transaction is not affected, but system time is spent on view maintenance • until updated, the view may be out-of-date • Preferable to denormalized schema since view maintenance is systems responsibility, not programmers • Avoids inconsistencies caused by errors in update programs
Tuning the Database Design (Cont.) • How to choose set of materialized views • Helping one transaction type by introducing a materialized view may hurt others • Choice of materialized views depends on costs • Users often have no idea of actual cost of operations • Overall, manual selection of materialized views is tedious • Some database systems provide tools to help DBA choose views to materialize • “Materialized view selection wizards”
Basic approaches to tuning of transactions Improve set orientation !!!!!!! Reduce lock contention Rewriting of queries to improve performance was important in the past, but smart optimizers have made this less important Tuning of Transactions
Communication overhead and query handling overheads significant part of cost of each call Combine multiple embedded SQL/ODBC/JDBC queries into a single set-oriented query Set orientation -> fewer calls to database E.g. tune program that computes total salary for each department using a separate SQL query by instead using a single query that computes total salaries for all department at once (using group by) Use stored procedures: avoids re-parsing and re-optimizationof query Tuning of Transactions