Enhancing Performance Analysis with the TAU Performance Database Framework
The TAU Performance Database Framework (PerfDBF) is designed to advance performance analysis in computational science by providing a robust architecture for empirical performance optimization. It enables the integration of multiple results from various experiments, platforms, and codes into a unified performance analysis framework. Using XML for profile data representation, PerfDBF facilitates data sharing, collaboration, and extensibility across performance tools. Through detailed examples such as scalability studies using the NAS Parallel Benchmark, users can effectively characterize and analyze their performance data, leading to improved software engineering practices.

Enhancing Performance Analysis with the TAU Performance Database Framework
E N D
Presentation Transcript
TAU Performance DataBaseFramework (PerfDBF) Allen D. Malony malony@cs.uoregon.edu Department of Computer and Information Science Computational Science Institute University of Oregon
Outline • Motivation for performance databases • TAU performance system • TAU Performanc DataBase Framework • Architecture • XML profile data representation • Example • Performance engineering in software engineering • X-PARE (eXPeriment Alerting and Reporting) • Concluding remarks
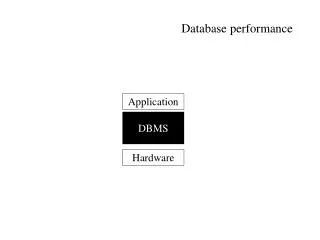
Why Performance Databases? • Focus on empirical performance optimization process • Necessary for multi-results performance analysis • Multiple experiments (codes, versions, platforms, …) • Historical performance comparison • Integral component of performance analysis framework • Improved performance analysis architecture design • More flexible and open tool interfaces • Supports extensibility and foreign tool interaction • Performance analysis collaboration • Performance tool sharing • Performance data sharing and knowledge base
Experiment Schemas PerformanceTuning hypotheses Performance Diagnosis properties Experiment Trials Performance Experimentation characterization Performance Observation observability requirements ? Empirical-Based Performance Optimization Process
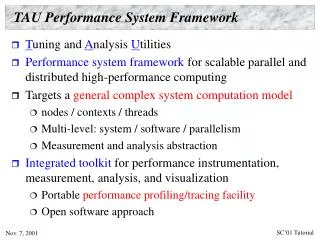
TAU Performance System Framework • Tuning and Analysis Utilities (aka Tools Are Us) • Performance system framework for scalable parallel and distributed high-performance computing • Targets a general complex system computation model • nodes / contexts / threads • Multi-level: system / software / parallelism • Measurement and analysis abstraction • Integrated toolkit for performance instrumentation, measurement, analysis, and visualization • Portable performance profiling/tracing facility • Open software approach
TAU Performance System Architecture Paraver EPILOG
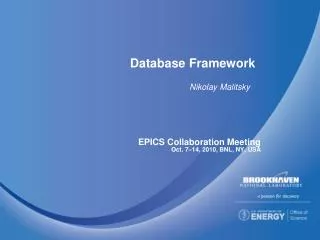
Performanceanalysis programs Raw performance data Performance data description Performance analysis and query toolkit PerfDML translators ORDB PostgreSQL . . . PerfDB TAU Performance Database Framework • profile data only • XML representation • project / experiment / trial
PerfDBF Components • Performance Data Meta Language (PerfDML) • Common performance data representation • Performance meta-data description • PerfDML translators to common data representation • Performance DataBase (PerfDB) • Standard database technology (SQL) • Free, robust database software (PostgresSQL) • Commonly available APIs • Performance DataBase Toolkit (PerfDBT) • Commonly used modules for query and analysis • Facility analysis tool development
Common and Extensible Profile Data Format • Goals • Capture data from profile tools in common representation • Implement representation in a standard format • Allow for extension of format for new profile data objects • Base on XML (obvious choice) • Leverage XML tools and APIs • XML parsers, Sun’s Java SDK, … • XML verification systems (DTD and schemas) • Target for profile data translation tools • eXtensibile Stylesheet Language Transformations (XSLT) • Which performance profile data are of interest? • Focus on TAU and consider other profiling tools
Performance Profiling • Performance data about program entities and behaviors • Code regions: functions, loops, basic blocks • Actions or states • Statistics data • Execution time, number of calls, number of FLOPS ... • Characterization data • Parallel profiles • Captured per process and/or per thread • Program-level summaries • Profiling tools • prof/gprof, ssrun, uprofile/dpci, cprof/vprof, …
PerfDBF Example • NAS Parallel Benchmark LU • % configure -mpiinc=/usr/include -mpilib=/usr/lib64 -arch=sgi64-fortran=sgi -SGITIMERS -useropt=-O2 NPB profiled With TAU Standard TAU Output Data TAU XML Format TAU to XML Converter Database Loader SQL Database AnalysisTool
Scalability Analysis Process • Scalability study on LU • % suite.def # of procs -> 1, 2, 4, and 8 • % mpirun -np 1 lu.W1 • % mpirun -np 2 lu.W2 • % mpirun -np 4 lu.W4 • % mpirun -np 8 lu.W8 • populateDatabase.sh • run Java translator to translate profiles into XML • run Java XML reader to write XML profiles to database • Read times for routines and program from experiments • Calculate scalability metrics
Raw TAU Profile Data • Raw data output • One processor: "applu ” 1 15 2939.096923828125 248744666.5830078 0 GROUP="applu“ • Four processors: "applu ” 1 15 2227.343994140625 51691412.17797852 0 GROUP="applu“ "applu ” 1 15 2227.343994140625 51691412.17797852 0 GROUP="applu“ "applu " 1 14 596.568115234375 51691519.34106445 0 GROUP="applu“ "applu " 1 14 616.833251953125 51691377.21313477 0 GROUP="applu" group name profile calls exclusive time inclusive time name subs calls
XML Profile Representation • One processor <instrumentedobj> <funcname> 'applu '</funcname> <funcID>8</funcID> <inclperc>100.0</inclperc> <inclutime>2.487446665830078E8</inclutime> <exclperc>0.0</exclperc> <exclutime>2939.096923828125 </exclutime> <call>1</call> <subrs>15</subrs> <inclutimePcall>2.487446665830078E8</inclutimePcall> </instrumentedobj>
XML Representation • Four processor mean <meanfunction> <funcname>'applu '</funcname> <funcID>12</funcID> <inclperc>100.0</inclperc> <inclutime>5.169148940026855E7</inclutime> <exclperc>0.0</exclperc> <exclutime>1044.487548828125</exclutime> <call>1</call> <subrs>14.25</subrs> <inclutimePcall>5.1691489E7</inclutimePcall> </meanfunction>
Scalability Analysis Results • Scalability of LU performance experiments • Four trial runs Funname | processors | meanspeedup …. applu | 2 | 2.0896117809566 applu | 4 | 4.812100975788783 applu | 8 | 8.168409581149514 … exact | 2 | 1.95853126762839071803 exact | 4 | 4.03622321124616535446 exact | 8 | 7.193812137750623668346
Current Status and Future • PerfDBF prototype • TAU profile to XML translator • XML to PerfDB populator • PostgresSQL database • Java-based PostgresSQL query module • Use as a layer to support performance analysis tools • Make accessing the Performance Database quicker • Continue development • XML parallel profile representation • Basic specification • Opportunity for APART to define a common format
Performance Tracking and Reporting • Integrated performance measurement allows performance analysis throughout development lifetime • Applied performance engineering in software design and development (software engineering) process • Create “performance portfolio” from regular performance experimentation (couple with software testing) • Use performance knowledge in making key software design decision, prior to major development stages • Use performance benchmarking and regression testing to identify irregularities • Support automatic reporting of “performance bugs” • Enable cross-platform (cross-generation) evaluation
XPARE - eXPeriment Alerting and REporting • Experiment launcher automates measurement / analysis • Configuration and compilation of performance tools • Instrumentation control for Uintah experiment type • Execution of multiple performance experiments • Performance data collection, analysis, and storage • Integrated in Uintah software testing harness • Reporting system conducts performance regression tests • Apply performance difference thresholds (alert ruleset) • Alerts users via email if thresholds have been exceeded • Web alerting setup and full performance data reporting • Historical performance data analysis
Mail server Web server XPARE System Architecture Experiment Launch Performance Database Performance Reporter Alerting Setup Comparison Tool Regression Analyzer
Other Performance Database Projects • HPM Toolkit (DeRose; IBM) • PPerfDB (Karavanic; Portland State University) • HPCView (Mellor-Crummey, Fowler;Rice) • SCALEA (Fahringer, Truong; University of Vienna) • EXPERT (Mohr, Wolf; Research Center Juelich)
Acknowledgements • University of Oregon • Li Li, Robert Bell, Sameer Shende • University of Utah • Alan Morris, Steve Parker, Dav St. Germain • Department of Energy (DOE), ASCI AcademicStrategic Alliances Program (ASAP) • Computational Science Institute, ASCI/ASAPLevel 3 projects with LLNL / LANL,University of Oregonhttp://www.csi.uoregon.edu • Center for the Simulation of Accidental Fires andExplosions (C-SAFE), ASCI/ASAP Level 1 center, University of Utahhttp://www.csafe.utah.edu