TAU Parallel Performance System
This paper provides an overview of the TAU Parallel Performance System, including its architecture and instrumentation approach. It discusses the motivation behind TAU, its goals, and its support for multi-level performance measurement and analysis. The paper also highlights the TAU Instrumentation approach, which provides flexible mechanisms for instrumentation at multiple levels, including source code, object code, and executable code. The paper concludes with examples of TAU's usage and its importance in solving performance problems in complex parallel systems.


TAU Parallel Performance System
E N D
Presentation Transcript
TAU Parallel Performance System Allen D. Malony, Sameer S. Shende, Robert BellKai Li, Li Li, Kevin Huck {malony,sameer,bertie,likai,lili,khuck}@cs.uoregon.edu Department of Computer and Information Science Performance Research Laboratory University of Oregon
Outline • Motivation • TAU architecture and toolkit • Instrumentation • Measurement • Analysis • Example applications • Users of TAU • Conclusion
Problem Domain • ASCI defines leading edge parallel systems and software • Large-scale systems and heterogenous platforms • Multi-model simulation • Complex software integration • Multi-language programming • Mixed-model parallelism • Complexity challenges performance analysis tools • System diversity requires portable tools • Need for cross-language support • Coverage of parallel computation models • Operate at scale
PerformanceTuning PerformanceTechnology hypotheses Performance Diagnosis • Experimentmanagement • Performancedatabase PerformanceTechnology properties Performance Experimentation • Instrumentation • Measurement • Analysis • Visualization characterization Performance Observation Research Motivation • Tools for performance problem solving • Empirical-based performance optimization process • Performance technology concerns
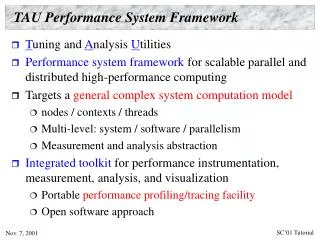
TAU Performance System • Tuning and Analysis Utilities (11+ year project effort) • Performance system framework for scalable parallel and distributed high-performance computing • Targets a general complex system computation model • nodes / contexts / threads • Multi-level: system / software / parallelism • Measurement and analysis abstraction • Integrated toolkit for performance instrumentation, measurement, analysis, and visualization • Portable performance profiling and tracing facility • Open software approach with technology integration • University of Oregon , Forschungszentrum Jülich, LANL
TAU Performance Systems Goals • Multi-level performance instrumentation • Multi-language automatic source instrumentation • Flexible and configurable performance measurement • Widely-ported parallel performance profiling system • Computer system architectures and operating systems • Different programming languages and compilers • Support for multiple parallel programming paradigms • Multi-threading, message passing, mixed-mode, hybrid • Support for performance mapping • Support for object-oriented and generic programming • Integration in complex software systems and applications
General Complex System Computation Model • Node:physically distinct shared memory machine • Message passing node interconnection network • Context: distinct virtual memory space within node • Thread: execution threads (user/system) in context Interconnection Network Inter-node messagecommunication * * Node Node Node node memory memory memory SMP physicalview VM space … modelview … Context Threads
Paraver EPILOG TAU Performance System Architecture
TAU Instrumentation Approach • Support for standard program events • Routines • Classes and templates • Statement-level blocks • Support for user-defined events • Begin/End events (“user-defined timers”) • Atomic events • Selection of event statistics • Support definition of “semantic” entities for mapping • Support for event groups • Instrumentation optimization
TAU Instrumentation • Flexible instrumentation mechanisms at multiple levels • Source code • manual • automatic • C, C++, F77/90/95 (Program Database Toolkit (PDT)) • OpenMP (directive rewriting (Opari), POMP spec) • Object code • pre-instrumented libraries (e.g., MPI using PMPI) • statically-linked and dynamically-linked • Executable code • dynamic instrumentation (pre-execution) (DynInstAPI) • virtual machine instrumentation (e.g., Java using JVMPI)
TAU Source Instrumentation • Automatic source instrumentation (TAUinstr) • Routine entry/exit and class method entry/exit • Block entry/exit and statement level (to be added) • Uses an instrumentation specification file • Include/exclude list for events and files • Uses command line options for group selection • Instrumentation event selection (TAUselect) • Automatic generation of instrumentation specification file • Instrumentation language to describe event constraints • Event identity and location • Event performance properties (e.g., overhead analysis) • Create TAUselect scripts for performance experiments
Multi-Level Instrumentation • Targets common measurement interface • TAU API • Multiple instrumentation interfaces • Simultaneously active • Information sharing between interfaces • Utilizes instrumentation knowledge between levels • Selective instrumentation • Available at each level • Cross-level selection • Targets a common performance model • Presents a unified view of execution • Consistent performance events
Program Database Toolkit (PDT) • Program code analysis framework • develop source-based tools • High-level interface to source code information • Integrated toolkit for source code parsing, database creation, and database query • Commercial grade front-end parsers • Portable IL analyzer, database format, and access API • Open software approach for tool development • Multiple source languages • Implement automatic performance instrumentation tools • tau_instrumentor
Program Database Toolkit (PDT) Application / Library C / C++ parser Fortran parser F77/90/95 Program documentation PDBhtml Application component glue IL IL SILOON C / C++ IL analyzer Fortran IL analyzer C++ / F90/95 interoperability CHASM Program Database Files Automatic source instrumentation TAU_instr DUCTAPE
PDT 3.0 Functionality • C++ statement-level information implementation • for, while loops, declarations, initialization, assignment… • PDB records defined for most constructs • DUCTAPE • Processes PDB 1.x, 2.x, 3.x uniformly • PDT applications • XMLgen • PDB to XML converter (Sottile) • Used for CHASM and CCA tools • PDBstmt • Statement callgraph display tool
PDT 3.0 Functionality (continued) • Cleanscape Flint parser fully integrated for F90/95 • Flint parser is very robust • Produces PDB records for TAU instrumentation (stage 1) • Linux x86, HP Tru64, IBM AIX • Tested on SAGE, POP, ESMF, PET benchmarking codes • Full PDB 2.0 specification (stage 2) [Q1 ‘04] • Statement level support (stage 3) [Q3 ‘04] • Open64 parser integrated in PDT for F90/95 • Barbara Chapman, University of Houston • Generate full PDB 2.0 specification (stage 2) [Q2 ‘04] • Statement level support (stage 3) [Q3 ‘04] • PDT 3.0 release at SC2003
TAU Performance Measurement • TAU supports profiling and tracing measurement • Robust timing and hardware performance support • Support for online performance monitoring • Profile and trace performance data export to file system • Selective exporting • Extension of TAU measurement for multiple counters • Creation of user-defined TAU counters • Access to system-level metrics • Support for callpath measurement • Integration with system-level performance data • Linux MAGNET/MUSE (Wu Feng, LANL)
TAU Measurement with Multiple Counters • Extend event measurement to capture multiple metrics • Begin/end (interval) events • User-defined (atomic) events • Multiple performance data sources can be queried • Associate counter function list to event • Defined statically or dynamically • Different counter sources • Timers and hardware counters • User-defined counters (application specified) • System-level counters • Monotonically increasing required for begin/end events • Extend user-defined counters to system-level counter
TAU Measurement • Performance information • Performance events • High-resolution timer library (real-time / virtual clocks) • General software counter library(user-defined events) • Hardware performance counters • PCL (Performance Counter Library) (ZAM, Germany) • PAPI (Performance API) (UTK, Ptools Consortium) • consistent, portable API • Organization • Node, context, thread levels • Profile groups for collective events (runtime selective) • Performance data mapping between software levels
TAU Measurement Options • Parallel profiling • Function-level, block-level, statement-level • Supports user-defined events • TAU parallel profile data stored during execution • Hardware counts values • Support for multiple counters • Support for callgraph and callpath profiling • Tracing • All profile-level events • Inter-process communication events • Trace merging and format conversion
Grouping Performance Data in TAU • Profile Groups • A group of related routines forms a profile group • Statically defined • TAU_DEFAULT, TAU_USER[1-5], TAU_MESSAGE, TAU_IO, … • Dynamically defined • group name based on string, such as “adlib” or “particles” • runtime lookup in a map to get unique group identifier • uses tau_instrumentor to instrument • Ability to change group names at runtime • Group-based instrumentation and measurement control
TAU Analysis • Parallel profile analysis • Pprof • parallel profiler with text-based display • ParaProf • Graphical, scalable, parallel profile analysis and display • Trace analysis and visualization • Trace merging and clock adjustment (if necessary) • Trace format conversion (ALOG, SDDF, VTF, Paraver) • Trace visualization using Vampir (Pallas)
Pprof Output (NAS Parallel Benchmark – LU) • Intel QuadPIII Xeon • F90 + MPICH • Profile - Node - Context - Thread • Events - code - MPI
ParaProf (NAS Parallel Benchmark – LU) Routine profile across all nodes node,context, thread Global profiles Event legend Individual profile
TAU + PAPI (NAS Parallel Benchmark – LU ) • Floating point operations • Re-link to alternate library • Can use multiple counter support
TAU + Vampir (NAS Parallel Benchmark – LU) Callgraph display Timeline display Parallelism display Communications display
TAU Performance System Status • Computing platforms (selected) • IBM SP / pSeries, SGI Origin 2K/3K, Cray T3E / SV-1 / X1, HP (Compaq) SC (Tru64), Sun, Hitachi SR8000, NEC SX-5/6, Linux clusters (IA-32/64, Alpha, PPC, PA-RISC, Power, Opteron), Apple (G4/5, OS X), Windows • Programming languages • C, C++, Fortran 77/90/95, HPF, Java, OpenMP, Python • Thread libraries • pthreads, SGI sproc, Java,Windows, OpenMP • Compilers (selected) • Intel KAI (KCC, KAP/Pro), PGI, GNU, Fujitsu, Sun, Microsoft, SGI, Cray, IBM (xlc, xlf), Compaq, NEC, Intel
Selected Applications of TAU • Center for Simulation of Accidental Fires and Explosion • University of Utah, ASCI ASAP Center, C-SAFE • Uintah Computational Framework (UCF) (C++) • Center for Simulation of Dynamic Response of Materials • California Institute of Technology, ASCI ASAP Center • Virtual Testshock Facility (VTF) (Python, Fortran 90) • Los Alamos National Lab • Monte Carlo transport (MCNP) (Susan Post) • Full code automatic instrumentation and profiling • ASCI Q validation and scaling • SAIC’s Adaptive Grid Eulerian (SAGE) (Jack Horner) • Fortran 90 automatic instrumentation and profiling
Selected Applications of TAU (continued) • Lawrence Livermore National Lab • Radiation diffusion (KULL) • C++ automatic instrumentation, callpath profiling • Sandia National Lab • DOE CCTTSS SciDAC project • Common component architecture (CCA) integration • Combustion code (C++, Fortran 90) • Flash Center • University of Chicago / Argonne, ASCI ASAP Center • FLASH code (C, Fortran 90)
Performance Analysis and Visualization • Analysis of parallel profile and trace measurement • Parallel profile analysis • ParaProf • ParaVis • Profile generation from trace data • Performance database framework (PerfDBF) • Parallel trace analysis • Translation to VTF 3.0 and EPILOG • Integration with VNG (Technical University of Dresden) • Online parallel analysis and visualization
ParaProf Framework Architecture • Portable, extensible, and scalable tool for profile analysis • Try to offer “best of breed” capabilities to analysts • Build as profile analysis framework for extensibility
Profile Manager Window • Structured AMR toolkit (SAMRAI++), LLNL
Full Profile Window (Exclusive Time) 512 processes
Full Profile Window (Metric-specific) 512 processes
ParaProf Enhancements • Readers completely separated from the GUI • Access to performance profile database • Profile translators • mpiP, papiprof, dynaprof • Callgraph display • prof/gprof style with hyperlinks • Integration of 3D performance plotting library • Scalable profile analysis • Statistical histograms, cluster analysis, … • Generalized programmable analysis engine • Cross-experiment analysis
ParaVis • Scalable parallel profile analysis • Scalable performance displays • 3D graphics • Analysis across profile samples • Allow for runtime use • Animated / interactive visualization • Initially develop with SCIRun • Computational environment • Performance graphics toolkit • Portable plotting library • OpenGL Performance Visualizer Performance Analyzer Performance Data Reader
Performance Visualization in SCIRun SCIRun program EVH1, IBM EVH1, Linux IA-32
“Scatterplot” Visualization • Each pointcoordinatedeterminedby threevalues: MPI_Reduce MPI_Recv MPI_Waitsome • Min/Maxvalue range • Effective forclusteranalysis Uintah
“Bargraph” Visualization (MPI routines) Uintah, 512 processes, ASCI Blue Pacific
Experiment management Experiment Schemas PerformanceTuning hypotheses Performance Diagnosis properties Experiment Trials Performance Experimentation characterization Performance Observation observability requirements ? Empirical-Based Performance Optimization Process
Performanceanalysis programs Raw performance data Other tools Performance data description Performance analysis and query toolkit PerfDML translators ORDB PostgreSQL . . . PerfDB TAU Performance Database Framework • profile data only • XML representation • project / experiment / trial
PerfDBF Components • Performance Data Meta Language (PerfDML) • Common performance data representation • Performance meta-data description • PerfDML translators to common data representation • Performance DataBase (PerfDB) • Standard database technology (SQL) • Free, robust database software (PostgresSQL, MySQL) • Commonly available APIs • Performance DataBase Toolkit (PerfDBT) • Commonly used modules for query and analysis • PerfDB API to facilitate analysis tool development
TAU Application (Selected) • SAMRAI (LLNL) • Overture (LLNL) • C-SAFE (ASCI ASAP, University of Utah) • VTF (ASCI ASAP, Caltech) • SAGE (ASCI LANL) • POOMA, POOMA-II (LANL, Code Sourcery) • PETSc (ANL) • CCA (DOE SciDAC) • GrACE (Rutgers University) • DOE ACTS toolkit • Aurora / SCALEA (University of Vienna)
Work in Progress • Trace visualization • Event traces with counters (Vampir 3.0 will visualize) • EPILOG trace conversion • Runtime performance monitoring and analysis • Online performance data access • Performance analysis and visualization in SCIRun • Performance Database Framework • XML parallel profile representation of TAU profiles • PostgresSQL performance database • Next-generation PDT • Performance analysis for component software (CCA)
Concluding Remarks • Complex software and parallel computing systems pose challenging performance analysis problems that require robust methodologies and tools • To build more sophisticated performance tools, existing proven performance technology must be utilized • Performance tools must be integrated with software and systems models and technology • Performance engineered software • Function consistently and coherently in software and system environments • TAU performance system offers robust performance technology that can be broadly integrated … so USE IT!