Download
1 / 56
560 likes | 590 Vues
Explore the advancements in TAU Performance System, addressing complexities in parallel and distributed systems, performance requirements, challenges, and tuning tools. Learn about the TAU framework's architecture, performance mapping, and instrumentation controls.

E N D
Recent Advances in theTAU Performance System Allen D. Malony, Sameer Shende {malony,shende}@cs.uoregon.edu Department of Computer and Information Science Computational Science Institute University of Oregon
Outline • Complexity and performance technology • What is the TAU performance system? • Problems currently being investigated • Instrumentation control and selection • Performance mapping and callpath profiling • Online performance analysis and visualization • Performance analysis for component software • Performance database framework • Concluding remarks
Complexity in Parallel and Distributed Systems • Complexity in computing system architecture • Diverse parallel and distributed system architectures • shared / distributed memory, cluster, hybrid, NOW, Grid, … • Sophisticated processor / memory / network architectures • Complexity in parallel software environment • Diverse parallel programming paradigms • Optimizing compilers and sophisticated runtime systems • Advanced numerical libraries and application frameworks • Hierarchical, multi-level software architectures • Multi-component, coupled simulation models
Complexity Determines Performance Requirements • Performance observability requirements • Multiple levels of software and hardware • Different types and detail of performance data • Alternative performance problem solving methods • Multiple targets of software and system application • Performance technology requirements • Broad scope of performance observation • Flexible and configurable mechanisms • Technology integration and extension • Cross-platform portability • Open, layered, and modular framework architecture
Complexity Challenges for Performance Tools • Computing system environment complexity • Observation integration and optimization • Access, accuracy, and granularity constraints • Diverse/specialized observation capabilities/technology • Restricted modes limit performance problem solving • Sophisticated software development environments • Programming paradigms and performance models • Performance data mapping to software abstractions • Uniformity of performance abstraction across platforms • Rich observation capabilities and flexible configuration • Common performance problem solving methods
General Problems (Performance Technology) How do we create robust and ubiquitous performance technology for the analysis and tuning of parallel and distributed software and systems in the presence of (evolving) complexity challenges? How do we apply performance technology effectively for the variety and diversity of performance problems that arise in the context of complex parallel and distributed computer systems?
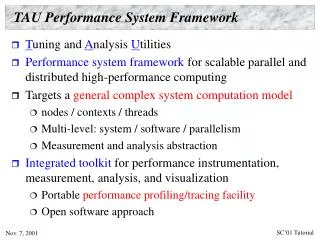
TAU Performance System Framework • Tuning and Analysis Utilities (aka Tools Are Us) • Performance system framework for scalable parallel and distributed high-performance computing • Targets a general complex system computation model • nodes / contexts / threads • Multi-level: system / software / parallelism • Measurement and analysis abstraction • Integrated toolkit for performance instrumentation, measurement, analysis, and visualization • Portable performance profiling/tracing facility • Open software approach
TAU Performance System Architecture Paraver EPILOG
Instrumentation Control and Selection • Selection of which performance events to observe • Could depend on scope, type, level of interest • Could depend on instrumentation overhead • How is selection supported in instrumentation system? • No choice • Include / exclude lists (TAU) • Environment variables • Static vs. dynamic • Problem: Controlling instrumentation of small routines • High relative measurement overhead • Significant intrusion and possible perturbation
Rule-Based Overhead Analysis (N. Trebon, UO) • Analyze the performance data to determine events with high (relative) overhead performance measurements • Create a select list for excluding those events • Rule grammar (used in TAUreduce tool) [GroupName:]Field Operator Number • GroupName indicates rule applies to events in group • Field is a event metric attribute (from profile statistics) • numcalls, numsubs, percent, usec, cumusec, totalcount, stdev, usecs/call, counts/call • Operator is one of >, <, or = • Number is any number • Compound rules possible using & between simple rules
TAUReduce Example • tau_reduce implements overhead reduction in TAU • Consider klargest example • Find kth largest element in a N elements • Compare two methods: quicksort, select_kth_largest • Testcase: i = 2324, N = 1000000 (uninstrumented) • quicksort: (wall clock) = 0.188511 secs • select_kth_largest: (wall clock) = 0.149594 secs • Total: (P3/1.2GHz time) = 0.340u 0.020s 0:00.37 • Execute with all routines instrumented • Execute with rule-based selective instrumentation usec>1000 & numcalls>400000 & usecs/call<30 & percent>25
Simple sorting example on one processor Before selective instrumentation reduction NODE 0;CONTEXT 0;THREAD 0: --------------------------------------------------------------------------------------- %Time Exclusive Inclusive #Call #Subrs Inclusive Name msec msec usec/call --------------------------------------------------------------------------------------- 100.0 13 4,982 1 4 4982030 int main 93.5 3,223 4,659 4.20241E+06 1.40268E+07 1 void quicksort 62.9 0.00481 3,134 5 5 626839 int kth_largest_qs 36.4 137 1,813 28 450057 64769 int select_kth_largest 33.6 150 1,675 449978 449978 4 void sort_5elements 28.8 1,435 1,435 1.02744E+07 0 0 void interchange 0.4 20 20 1 0 20668 void setup 0.0 0.0118 0.0118 49 0 0 int ceil After selective instrumentation reduction NODE 0;CONTEXT 0;THREAD 0: --------------------------------------------------------------------------------------- %Time Exclusive Inclusive #Call #Subrs Inclusive Name msec total msec usec/call --------------------------------------------------------------------------------------- 100.0 14 383 1 4 383333 int main 50.9 195 195 5 0 39017 int kth_largest_qs 40.0 153 153 28 79 5478 int select_kth_largest 5.4 20 20 1 0 20611 void setup 0.0 0.02 0.02 49 0 0 int ceil
Performance Mapping • Associate performance with “significant” entities (events) • Source code points are important • Functions, regions, control flow events, user events • Execution process and thread entities are important • Some entities are more abstract, harder to measure • Consider callgraph (callpath) profiling • Measure time (metric) along an edge (path) of callgraph • incident edge gives parent / child view • edge sequence (path) gives parent / descendant view • Problem: Callpath profiling when callgraph is unknown • Determine callgraph dynamically at runtime • Map performance measurement to dynamic call path state
A C B D E F G H I Callgraph (Callpath) Profiling • 0-level callpath • Callgraph node • A • 1-level callpath • Immediate descendant • AB, EI, DH • CH ? • k-level callpath (k>1) • k call descendant • 2-level: AD, CI • 2-level: AI ? • 3-level: AH
1-Level Callpath Profiling in TAU (S. Shende, UO) • TAU maintains a performance event (routine) callstack • Profiled routine (child) looks in callstack for parent • Previous profiled performance event is the parent • A callpath profile structure created first time parent calls • TAU records parent in a callgraph map for child • String representing 1-level callpath used as its key • “a( )=>b( )” : name for time spent in “b” when called by “a” • Map returns pointer to callpath profile structure • 1-level callpath is profiled using this profiling data • Build upon TAU’s performance mapping technology • Measurement is independent of instrumentation
Callpath Profiling Example (NAS LU v2.3) % configure -PROFILECALLPATH -SGITIMERS -arch=sgi64-mpiinc=/usr/include -mpilib=/usr/lib64 -useropt=-O2
Callpath Parallel Profile Display • 0-level and 1-level callpath grouping 0-Level Callpath 1-Level Callpath
Performance Monitoring and Steering • Desirable to monitor performance during execution • Long-running applications • Steering computations for improved performance • Large-scale parallel applications complicate solutions • More parallel threads of execution producing data • Large amount of performance data (relative) to access • Analysis and visualization more difficult • Problem: Online performance data access and analysis • Incremental profile sampling (based on files) • Integration in computational steering system • Dynamic performance measurement and access
SCIRun (Univ. of Utah) Performance Visualizer Performance Steering Application // performance data streams TAU Performance System Performance Analyzer // performance data output accumulated samples Performance Data Integrator Performance Data Reader file system • sample sequencing • reader synchronization Online Performance Analysis (K. Li, UO)
2D Field Performance Visualization in SCIRun SCIRun program
Uintah Computational Framework (UCF) • Universityof Utah • UCF analysis • Scheduling • MPI library • Components • 500 processes • Use for onlineand offlinevisualization • Apply SCIRunsteering
Performance Analysis of Component Software • Complexity in scientific problem solving addressed by • advances in software development environments • rich layered software middleware and libraries • Increases complexity in performance problem solving • Integration barriers for performance technology • Incompatible with advanced software technology • Inconsistent with software engineering process • Problem: Performance engineering for component systems • Respect software development methodology • Leverage software implementation technology • Look for opportunities for synergy and optimization
Focus on Component Technology and CCA • Emerging component technology for HPC and Grid • Component: software object embedding functionality • Component architecture (CA): how components connect • Component framework: implement a CA • Common Component Architecture (CCA) • Standard foundation for scientific component architecture • Component descriptions • Scientific Interface Description Language (SIDL) • CCA ports for component interactions (provides and uses) • CCA services: directory, registery, connection, event • High-performance components and interactions
Extend Component Design for Performance • Compliant with component architecture • Component composition performance engineering • Utilize technology and services of component framework genericcomponent
Performance Knowledge • Describe and store “known” component’s performance • Benchmark characterizations in performance database • Models of performance • empirical-based • simulation-based • analytical-based • Saved information about component performance • Use for performance-guided selection and deployment • Use for runtime adaptation • Representation must be in common forms with standard means for accessing the performance information
Performance Knowledge Repository & Component • Component performance repository • Implement in componentarchitecture framework • Similar to CCA componentrepository • Access by componentinfrastructure • View performance knowledge as component (PKC) • PKC ports give access to performance knowledge • to other components back to original component • Static/dynamic component control and composition • Component composition performance knowledge
Performance Observation • Ability to observe execution performance is important • Empirically-derived performance knowledge requires it • does not require measurement integration in component • Monitor during execution to make dynamic decisions • measurement integration is key • Performance observation integration • Component integration: core and variant • Runtime measurement and data collection • On-line and off-line performance analysis • Performance observation technology must be as portable and robust as component software
Performance Observation Component (POC) • Performance observation in aperformance-engineeredcomponent model • Functional extension of originalcomponent design ( ) • Include new componentmethods and ports ( ) for othercomponents to access measured performance data • Allow original component to access performance data • encapsulate as tightly-couple and co-resident performance observation object • POC “provides” port allow use optmized interfaces ( )to access ``internal'' performance observations
Ports Performance Component Timer Event Query Knowledge Architecture of a Performance Component • Each component advertises its services • Performance component: • Timer (start/stop) • Event (trigger) • Query (timers…) • Knowledge (component performance model) • Prototype implementation of timer • CCAFFEINE reference framework • http://www.cca-forum.org/café.html • SIDL • Instantiate with TAU functionality
TimerPort Interface Declaration in CCAFEINE namespace performance{ namespace ccaports{ /** * This abstract class declares the Timer interface. * Inherit from this class to provide functionality. */ class Timer: /* implementation of port */ public virtual gov::cca::Port { /* inherits from port spec */ public: virtual ~ Timer (){ } /** * Start the Timer. Implement this function in * a derived class to provide required functionality. */ virtual void start(void) = 0; /* virtual methods with */ virtual void stop(void) = 0; /* null implementations */ ... } • Create Timer port abstraction
Using Performance Component Timer // Get Timer port from CCA framework services form CCAFFEINE port = frameworkServices->getPort ("TimerPort"); if (port) timer_m = dynamic_cast < performance::ccaports::Timer * >(port); if (timer_m == 0) { cerr << "Connected to something, not a Timer port" << endl; return -1; } string s = "IntegrateTimer"; // give name for timer timer_m->setName(s); // assign name to timer timer_m->start(); // start timer (independent of tool) for (int i = 0; i < count; i++) { double x = random_m->getRandomNumber (); sum = sum + function_m->evaluate (x); } timer_m->stop(); // stop timer • Component uses framework services to get TimerPort • Use of this TimerPort interface is independent of TAU
Using SIDL for Language Interoperability // // File: performance.sidl // version performance 1.0; package performance { class Timer { void start(); void stop(); void setName(in string name); string getName(); void setType(in string name); string getType(); void setGroupName(in string name); string getGroupName(); void setGroupId(in long group); long getGroupId(); } } • Can create Timer interface in SIDL for creating stubs
Using SIDL Interface for Timers // SIDL: #include "performance_Timer.hh" int main(int argc, char* argv[]) { performance::Timer t = performance::Timer::_create(); ... t.setName("Integrate timer"); t.start(); // Computation for (int i = 0; i < count; i++) { double x = random_m->getRandomNumber (); sum = sum + function_m->evaluate (x); } ... t.stop(); return 0; } • C++ program that uses the SIDL Timer interface • Again, independent of timer implementations (e.g., TAU)
Using TAU Component in CCAFEINE repository get TauTimer /* get TAU component from repository */ repository get Driver /* get application components */ repository get MidpointIntegrator repository get MonteCarloIntegrator repository get RandomGenerator repository get LinearFunction repository get NonlinearFunction repository get PiFunction create LinearFunction lin_func /* create component instances */ create NonlinearFunction nonlin_func create PiFunction pi_func create MonteCarloIntegrator mc_integrator create RandomGenerator rand create TauTimer tau /* create TAU component instance */ /* connecting components and running */ connect mc_integrator RandomGeneratorPort rand RandomGeneratorPort connect mc_integrator FunctionPort nonlin_func FunctionPort connect mc_integrator TimerPort tau TimerPort create Driver driver connect driver IntegratorPort mc_integrator IntegratorPort go driver Go quit
Component Composition Performance Engineering • Performance of component-based scientific applicationsdepends on interplay • Component functions • Computational resources available • Management of component compositions throughout execution is critical to successful deployment and use • Identify key technological capabilities needed to support the performance engineering of component compositions • Two model concepts • Performance awareness • Performance attention
Performance Awareness of Component Ensembles • Composition performance knowledge and observation • Composition performance knowledge • Can come from empirical and analytical evaluation • Can utilize information provided at the component level • Can be stored in repositories for future review • Extends the notion of component observation to ensemble-level performance monitoring • Associate monitoring components hierarchical component grouping • Build upon component-level observation support • Monitoring components act as performance integrators and routers • Use component framework mechanisms
Performance Databases • Focus on empirical performance optimization process • Necessary for multi-results performance analysis • Multiple experiments (codes, versions, platforms, …) • Historical performance comparison • Integral component of performance analysis framework • Improved performance analysis architecture design • More flexible and open tool interfaces • Supports extensibility and foreign tool interaction • Performance analysis collaboration • Performance tool sharing • Performance data sharing and knowledge base
Experiment Schemas PerformanceTuning hypotheses Performance Diagnosis properties Experiment Trials Performance Experimentation characterization Performance Observation observability requirements ? Empirical-Based Performance Optimization Process
Performanceanalysis programs Raw performance data Performance data description Performance analysis and query toolkit PerfDML translators ORDB PostgreSQL . . . PerfDB TAU Performance Database Framework • profile data only • XML representation (PerfDML) • project / experiment / trial
PerfDBF Components • Performance Data Meta Language (PerfDML) • Common performance data representation • Performance meta-data description • Translators to common PerfDML data representation • Performance DataBase (PerfDB) • Standard database technology (SQL) • Free, robust database software (PostgresSQL) • Commonly available APIs • Performance DataBase Toolkit (PerfDBT) • Commonly used modules for query and analysis • Facility analysis tool development
Common and Extensible Profile Data Format • Goals • Capture data from profile tools in common representation • Implement representation in a standard format • Allow for extension of format for new profile data objects • Base on XML (obvious choice) • Leverage XML tools and APIs • XML parsers, Sun’s Java SDK, … • XML verification systems (DTD and schemas) • Target for profile data translation tools • eXtensibile Stylesheet Language Transformations (XSLT) • Which performance profile data are of interest? • Focus on TAU and consider other profiling tools
Performance Profiling • Performance data about program entities and behaviors • Code regions: functions, loops, basic blocks • Actions or states • Statistics data • Execution time, number of calls, number of FLOPS ... • Characterization data • Parallel profiles • Captured per process and/or per thread • Program-level summaries • Profiling tools • prof/gprof, ssrun, uprofile/dpci, cprof/vprof, …
PerfDBF Example • NAS Parallel Benchmark LU • % configure -mpiinc=/usr/include -mpilib=/usr/lib64-arch=sgi64 -fortran=sgi -SGITIMERS -useropt=-O2 NPB profiled With TAU Standard TAU Output Data TAU XML Format TAU to XML Converter Database Loader SQL Database AnalysisTool
Scalability Analysis Process • Scalability study on LU • Vary number of processes: 1, 2, 4, and 8 • % mpirun -np 1 lu.W1 • % mpirun -np 2 lu.W2 • % mpirun -np 4 lu.W4 • % mpirun -np 8 lu.W8 • Populate the performance database • run Java translator to translate profiles into XML • run Java XML reader to write XML profiles to database • Read times for routines and program from experiments • Calculate scalability metrics
Raw TAU Profile Data • Raw data output • One processor: "applu ” 1 15 2939.096923828125 248744666.5830078 0 GROUP="applu“ • Four processors: "applu ” 1 15 2227.343994140625 51691412.17797852 0 GROUP="applu“ "applu ” 1 15 2227.343994140625 51691412.17797852 0 GROUP="applu“ "applu " 1 14 596.568115234375 51691519.34106445 0 GROUP="applu“ "applu " 1 14 616.833251953125 51691377.21313477 0 GROUP="applu" group name profile calls exclusive time inclusive time name subs calls
XML Profile Representation • One processor <instrumentedobj> <funcname> 'applu '</funcname> <funcID>8</funcID> <inclperc>100.0</inclperc> <inclutime>2.487446665830078E8</inclutime> <exclperc>0.0</exclperc> <exclutime>2939.096923828125 </exclutime> <call>1</call> <subrs>15</subrs> <inclutimePcall>2.487446665830078E8</inclutimePcall> </instrumentedobj>
XML Representation • Four processor mean <meanfunction> <funcname>'applu '</funcname> <funcID>12</funcID> <inclperc>100.0</inclperc> <inclutime>5.169148940026855E7</inclutime> <exclperc>0.0</exclperc> <exclutime>1044.487548828125</exclutime> <call>1</call> <subrs>14.25</subrs> <inclutimePcall>5.1691489E7</inclutimePcall> </meanfunction>
Scalability Analysis Results • Scalability of LU performance experiments • Four trial runs Funname | processors | meanspeedup …. applu | 2 | 2.0896117809566 applu | 4 | 4.812100975788783 applu | 8 | 8.168409581149514 … exact | 2 | 1.95853126762839071803 exact | 4 | 4.03622321124616535446 exact | 8 | 7.193812137750623668346