TAU Performance System Framework
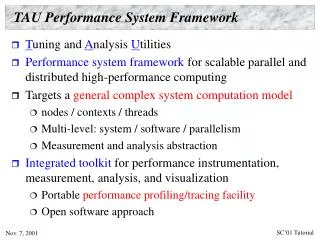
TAU Performance System Framework. T uning and A nalysis U tilities Performance system framework for scalable parallel and distributed high-performance computing Targets a general complex system computation model nodes / contexts / threads Multi-level: system / software / parallelism

TAU Performance System Framework
E N D
Presentation Transcript
TAU Performance System Framework • Tuning and Analysis Utilities • Performance system framework for scalable parallel and distributed high-performance computing • Targets a general complex system computation model • nodes / contexts / threads • Multi-level: system / software / parallelism • Measurement and analysis abstraction • Integrated toolkit for performance instrumentation, measurement, analysis, and visualization • Portable performance profiling/tracing facility • Open software approach
General Complex System Computation Model • Node:physically distinct shared memory machine • Message passing node interconnection network • Context: distinct virtual memory space within node • Thread: execution threads (user/system) in context Interconnection Network Inter-node messagecommunication * * Node Node Node node memory memory memory SMP physicalview VM space … modelview … Context Threads
TAU Instrumentation • Flexible instrumentation mechanisms at multiple levels • Source code • manual • automatic using Program Database Toolkit (PDT) • Object code • pre-instrumented libraries (e.g., MPI using PMPI) • statically linked • dynamically linked • fast breakpoints (compiler generated) • Executable code • dynamic instrumentation (pre-execution) using DynInstAPI
TAU Instrumentation (continued) • Targets common measurement interface (TAU API) • Object-based design and implementation • Macro-based, using constructor/destructor techniques • Program units: function, classes, templates, blocks • Uniquely identify functions and templates • name and type signature (name registration) • static object creates performance entry • dynamic object receives static object pointer • runtime type identification for template instantiations • C and Fortran instrumentation variants • Instrumentation and measurement optimization
Program Database Toolkit (PDT) • Program code analysis framework for developing source-based tools • High-level interface to source code information • Integrated toolkit for source code parsing, database creation, and database query • commercial grade front end parsers • portable IL analyzer, database format, and access API • open software approach for tool development • Target and integrate multiple source languages • Use in TAU to build automated performance instrumentation tools
PDT Architecture and Tools C/C++ Fortran 77/90
PDT Components • Language front end • Edison Design Group (EDG): C, C++, Java • Mutek Solutions Ltd.: F77, F90 • creates an intermediate-language (IL) tree • IL Analyzer • processes the intermediate language (IL) tree • creates “program database” (PDB) formatted file • DUCTAPE (Bernd Mohr, ZAM, Germany) • C++ program Database Utilities and Conversion Tools APplication Environment • processes and merges PDB files • C++ library to access the PDB for PDT applications
TAU Measurement • Performance information • High-resolution timer library (real-time / virtual clocks) • General software counter library(user-defined events) • Hardware performance counters • PCL (Performance Counter Library) (ZAM, Germany) • PAPI (Performance API) (UTK, Ptools Consortium) • consistent, portable API • Organization • Node, context, thread levels • Profile groups for collective events (runtime selective) • Performance data mapping between software levels
TAU Measurement (continued) • Parallel profiling • Function-level, block-level, statement-level • Supports user-defined events • TAU parallel profile database • Function callstack • Hardware counts values (in replace of time) • Tracing • All profile-level events • Interprocess communication events • Timestamp synchronization • User-configurable measurement library (user controlled)
TAU Measurement API • Initialization and runtime configuration • TAU_PROFILE_INIT(argc, argv);TAU_PROFILE_SET_NODE(myNode);TAU_PROFILE_SET_CONTEXT(myContext);TAU_PROFILE_EXIT(message); • Function and class methods • TAU_PROFILE(name, type, group); • Template • TAU_TYPE_STRING(variable, type);TAU_PROFILE(name, type, group);CT(variable); • User-defined timing • TAU_PROFILE_TIMER(timer, name, type, group);TAU_PROFILE_START(timer);TAU_PROFILE_STOP(timer);
TAU Measurement API (continued) • User-defined events • TAU_REGISTER_EVENT(variable, event_name);TAU_EVENT(variable, value);TAU_PROFILE_STMT(statement); • Mapping • TAU_MAPPING(statement, key);TAU_MAPPING_OBJECT(funcIdVar);TAU_MAPPING_LINK(funcIdVar, key); • TAU_MAPPING_PROFILE (funcIdVar);TAU_MAPPING_PROFILE_TIMER(timer, funcIdVar);TAU_MAPPING_PROFILE_START(timer);TAU_MAPPING_PROFILE_STOP(timer); • Reporting • TAU_REPORT_STATISTICS();TAU_REPORT_THREAD_STATISTICS();
TAU Analysis • Profile analysis • Pprof • parallel profiler with text-based display • Racy • graphical interface to pprof (Tcl/Tk) • jRacy • Java implementation of Racy • Trace analysis and visualization • Trace merging and clock adjustment (if necessary) • Trace format conversion (ALOG, SDDF, Vampir) • Vampir (Pallas) trace visualization
Pprof Command • pprof [-c|-b|-m|-t|-e|-i] [-r] [-s] [-n num] [-f file] [-l] [nodes] • -c Sort according to number of calls • -b Sort according to number of subroutines called • -m Sort according to msecs (exclusive time total) • -t Sort according to total msecs (inclusive time total) • -e Sort according to exclusive time per call • -i Sort according to inclusive time per call • -v Sort according to standard deviation (exclusive usec) • -r Reverse sorting order • -s Print only summary profile information • -n num Print only first number of functions • -f file Specify full path and filename without node ids • -l nodes List all functions and exit (prints only info about all contexts/threads of given node numbers)
Pprof Output (NAS Parallel Benchmark – LU) • Intel Quad PIII Xeon, RedHat, PGI F90 • F90 + MPICH • Profile for: Node Context Thread • Application events and MPI events
jRacy (NAS Parallel Benchmark – LU) Routine profile across all nodes Global profiles n: node c: context t: thread Individual profile
TAU and PAPI (NAS Parallel Benchmark – LU ) • Floating point operations • Replaces execution time • Only requires relinking to different measurementlibrary
Semantic Performance Mapping • Associate performance measurements with high-level semantic abstractions • Need mapping support in the performance measurement system to assign data correctly
Semantic Entities/Attributes/Associations (SEAA) • New dynamic mapping scheme (S. Shende, Ph.D. thesis) • Contrast with ParaMap (Miller and Irvin) • Entities defined at any level of abstraction • Attribute entity with semantic information • Entity-to-entity associations • Two association types (implemented in TAU API) • Embedded – extends data structure of associated object to store performance measurement entity • External – creates an external look-up table using address of object as the key to locate performance measurement entity
TAU Performance System Status • Computing platforms • IBM SP, SGI Origin 2K/3K, Intel Teraflop, Cray T3E, Compaq SC, HP, Sun, Windows, IA-32, IA-64, Linux, … • Programming languages • C, C++, Fortran 77/90, HPF, Java, OpenMP • Communication libraries • MPI, PVM, Nexus, Tulip, ACLMPL, MPIJava • Thread libraries • pthreads, Java,Windows, Tulip, SMARTS, OpenMP • Compilers • KAI, PGI, GNU, Fujitsu, Sun, Microsoft, SGI, Cray, IBM, Compaq
TAU Performance System Status (continued) • Application libraries • Blitz++, A++/P++, ACLVIS, PAWS, SAMRAI, Overture • Application frameworks • POOMA, POOMA-2, MC++, Conejo, Uintah, UPS, … • Performance Projects • Aurora / SCALEA: ACPC, University of Vienna • TAU full distribution(Version 2.10, web download) • Measurement library and profile analysis tools • Automatic software installation • Performance analysis examples • Extensive TAU User’s Guide
PDT Status • Program Database Toolkit (Version 2.0, web download) • EDG C++ front end (Version 2.45.2) • Mutek Fortran 90 front end (Version 2.4.1) • C++ and Fortran 90 IL Analyzer • DUCTAPE library • Standard C++ system header files (KCC Version 4.0f) • PDT-constructed tools • Automatic TAU performance instrumentation • C, C++, Fortran 77, and Fortran 90 • Program analysis support for SILOON and CHASM
Usage Scenarios • Message passing computation • Multi-threaded computation • (Abstract) thread-based performance measurement • Multi-threaded parallel execution and asynchronous RTS • Mixed-mode parallel computation • Integrate messaging events with multi-threading events • OpenMP + MPI, Java + MPI, … • Object-oriented programming and C++ • Performance measurement of template-derived code • Object-based performance analysis • Hierarchical parallel software frameworks • Multi-level software framework and work scheduling
Evolution of the TAU Performance System • TAU’s existing strength lies in its robust support for performance instrumentation and measurement • TAU will evolve to support new performance capabilities • Online performance data access via application-level API • Whole-system, integrative performance monitoring • Dynamic performance measurement control • Generalize performance mapping • Runtime performance analysis and visualization • Performance experimentation environment and database • Cross-experiment performance analysis • Three-year DOE MICS research and development grant