Chapter 6 Frequency Response
Chapter 6 Frequency Response. Hieronymus Bosch Garden of Delights . http://kunst.gymszbad.de/kunstgeschichte/motivgeschichte/altaere/frame-menue.htm. Master of Flemalle ( Robert Campin) Mérode-Altar . The central panel shows the Annunciation.


Chapter 6 Frequency Response
E N D
Presentation Transcript
Chapter 6 Frequency Response
Hieronymus BoschGarden of Delights • http://kunst.gymszbad.de/kunstgeschichte/motivgeschichte/altaere/frame-menue.htm
Master of Flemalle ( Robert Campin)Mérode-Altar The central panel shows the Annunciation. The child is already on his way on golden rays… • http://kunst.gymszbad.de/kunstgeschichte/motivgeschichte/altaere/frame-menue.htm
Master of Flemalle ( Robert Campin)Mérode-Altar The Cloisters New York, NY • http://kunst.gymszbad.de/kunstgeschichte/motivgeschichte/altaere/frame-menue.htm Detail: The child is already on his way on golden rays, carrying the cross of the passion with him.
Master of Flemalle ( Robert Campin)Mérode-Altar The Metropolitan Museum of Art, The Cloisters New York, NY Another Detail: St. Joseph the carpenter (right panel) has just completed a mousetrap (on the table), possibly to trap the devil.
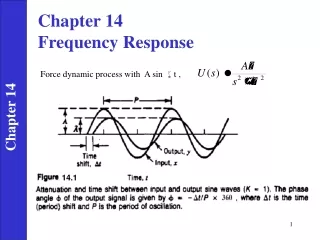
An Example: Analysis of Sound Waves Time domain signals: Square Wave and triangular wave.
Analysis of Sound Waves Fundam. freq HARMONICS The second harmonic is twice the fundam-ental frequency, the third harmonic is three times the fundam. frequency, and so forth. Time domain signal analysis: Spectrum ofSquare Wave
Fourier Transform: Let period T infinity The interval between Discrete frequencies 0 The Fourier series becomes the Fourier Transform
The A(w) and B(w) terms of the Fourier Transform can be combined into the complex term C(jw) becomes
where Compare with the definition of the Laplace Transform
A Sound Wave and its Spectrum
Question: How do we recognize voices or musical instruments?
Answer: Our brains perform a real time spectral analysis of the incoming sound signal. The spectrum, not the signal itself, informs us about the source.
Question: How do we recognize color?
Bode Plots: • Same content as polar plot, just a different mode of presentation. • Bode Plots: • Logarithmic w-axis. Logarithmic |F| (magnitude axis) Why? Phase values are entered directly Why?
G(s)= K/(ts+1) Basic Bode Plot (First Order) Break Frequency wb f = -45deg. at wb 2. wb at -45 deg. And |F| = 0.707
Bode Magnitude Plot K = 2 wb =5 1. Note K and wb 2. Draw |F| from low freq to wb 3. Draw |F| from wb , slope -1/decade
Bode Phase Plot 1. Phase = -450 at wb 2. Draw f from 0 to wb/10, slope =0 3. Draw f from wb/10 freq to 10*wb 4. Min Phase is -900 from 10*wb
Decibels • An alternate unit of Magnitude or Gain • Definition: xdB = 20* lg(x) • dB Notation is widely used in Filter theory and Acoustics
Decibels • An alternate unit of Magnitude or Gain • Definition: xdB = 20* lg(x)
Bode Plot of Integrator G(s) = 1/(s) |F|= 1/w f = -tan-1(w/0) = -900 Memorize!
Underdamped second order systems and Resonance Asymptote Slope = -2 Phase is -90 deg. at wn
Bode Plot Construction G(s) = 2/(s)(s+1) 1. Construct each Element plot 2. Graphical Summation Gain = 2. Integrator Slope = -1 Slope = -2 Integrator Phase = -90 deg.
Bode Plot Construction G(s) = 5*(s+1)/(10s+1)(100s+1) 1. Construct each Element plot Slope = -1 K = 5 Slope = -2 2. Graphical Summation: Complete plot. Note beginning and final values Slope = -1
Phase Plot Construction 2. Graphical Summation of phase angles. Note beginning and final phase values. Here: f = 0 at w = 0, and f = -90 final angle G(s) = 5*(s+1)/(10s+1)(100s+1) K = 5 Initial Phase is zero to 0.001, follows the first Phase up to 0.01 Final phase: Constant - 90 deg - 90 deg./decade +45 deg./decade 0 deg./decade
Nyquist Criterion:Closed Loop Stability: Evaluate Frequency response at Phase of -180 degrees
Nyquist Criterion in the Bode Plot:Gain Margin and Phase Margin Gain Margin Phase Margin
Nyquist Criterion in the Bode Plot:Gain Margin and Phase Margin
Bode Lead Design 1. Select Lead zero such that the phase margin increases while keeping the gain crossover frequency as low as reasonable. 2. Adjust Gain to the desired phase margin.
Lead compensator |p| = 10*z G(s) = 1. Construct each Element plot 2. Graphical Summation Slope = 0 Slope = +1 Note Break Frequencies Slope = 0 Gain = 1 Slope = 0 Slope = 0 Slope = 0 Phase = 0