Download

1 / 35
350 likes | 521 Vues
September 18, 2008. Out of the Storm ’08. Jeffrey Fieldson Nashville, Tennessee. State of Florida (1851-2005). 2004 Hurricane Season. 2005 Hurricane Season. 2006 Hurricane Season. 2007 Hurricane Season. 2007 Hurricanes – Dean & Felix.

E N D
September 18, 2008 Out of the Storm ’08 Jeffrey Fieldson Nashville, Tennessee
2007 Hurricanes – Dean & Felix Only four times — in the 1960, 1961, 2005 and 2007 hurricane seasons — have multiple Category 5 hurricanes formed. Only in 2005 have more than two category 5 storms formed, and only in 2007 has more than one made landfall at category 5 strength.
U.S. Insured Catastrophe Losses* $ Billions $100 Billion CAT year is coming soon 2006/07 were welcome respites. 2005 was by far the worst year ever for insured catastrophe losses in the US, but the worst has yet to come. *Excludes $4B-$6b offshore energy losses from Hurricanes Katrina & Rita. Note: 2001 figure includes $20.3B for 9/11 losses reported through 12/31/01. Includes only business and personal property claims, business interruption and auto claims. Non-prop/BI losses = $12.2B. Source: Property Claims Service/ISO; Insurance Information Institute
Top 10 Most Costly Hurricanes in US History, (Insured Losses, $2005) Seven of the 10 most expensive hurricanes in US history occurred in the 14 months from Aug. 2004 – Oct. 2005: Katrina, Rita, Wilma, Charley, Ivan, Frances & Jeanne Sources: ISO/PCS; Insurance Information Institute.
Nightmare Scenario: Insured Property Losses for NJ/NY CAT 3/4 Storm Insured Losses: $110B Economic Losses: $200B+ Distribution of Insured Property Losses, by State, ($ Billions) Total Insured Property Losses = $110B, nearly 3 times that of Hurricane Katrina Source: AIR Worldwide
Track of “Long Island Express” Hurricane of 1938 “Great New England Hurricane” of 1938 a.k.a.“Long Island Express” caused severe damage through much of the Northeast. • 600+ Deaths • $308 million Source: WeatherUnderground.com, accessed February 4, 2006.
Storm Season of 1944: A Busy one for the Northeast Three storms affected NY, NJ and New England in 1944, including “Great Atlantic Hurricane” • 46 deaths • $100 million damage • 109mph gusts in Hartford Source: WeatherUnderground.com, accessed May 31, 2006; NOAA loss & fatality figures.
Storm Season of 1954: The Northeast Hit Again NY/New England areas hit by Carol & Edna two weeks apart • Carol: 8-10 ft. floodwaters in Providence • Edna hits Cape Cod • Combined: 80 deaths, $501 million losses Source: WeatherUnderground.com, accessed May 31, 2006; NOAA loss & fatality figures.
Storm Season of 1960: Brenda & Donna Came to Visit NY/New England areas were hit twice in 1960. • Donna killed 50, $387 million damage along East Coast Source: WeatherUnderground.com, accessed May 31, 2006; NOAA loss & fatality figures.
After a 25 Year Hiatus, Hurricane Gloria Hit in 1985 NY/New England areas were hit by Gloria 9/27/85 • 8 deaths • $900 million damage Source: WeatherUnderground.com, accessed May 31, 2006; NOAA loss & fatality figures.
Floyd Visited in 1999, Causing $4.5 Billion in Losses NY/New England areas were hit by Floyd 9/14 – 9/17/99 • $4.5 B in damage US Source: WeatherUnderground.com, accessed September 16, 2007; NOAA loss & fatality figures.
17 ft storm tide 15 ft surge 2 ft normal high tide Mean Sea Level STORM TIDE FACTS • More than 8,000 people were killed in the 1900 Galveston hurricane, most by the storm tide. • Hurricane Camille in 1969 produced a 24-foot storm tide in Mississippi. • Hurricane Hugo in 1989 generated a 20-foot storm tide in South Carolina. • Hurricane Katrina in 2005 generated a 27-foot storm tide in Mississippi.
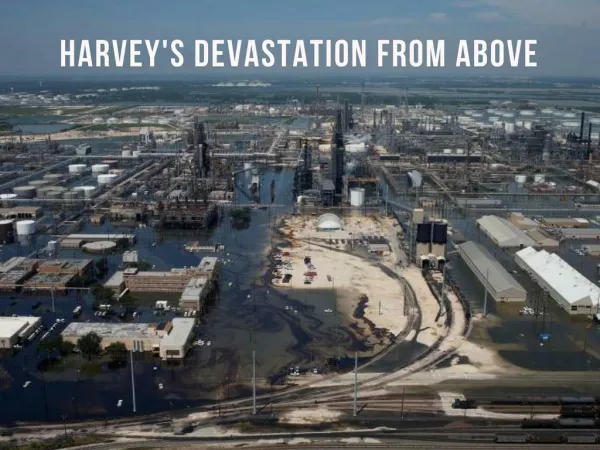
Hurricane Ike Stats • Will become the third most costly hurricane in U.S. history • Was a CAT 2 storm with sustained winds of 110 mph. This was 1 mph below a CAT 3 level storm. • 48 deaths confirmed in the U.S. – 80 in the Caribbean • 4 million people without power after Ike made landfall • 2 million residents in Houston without power as of 25 September • 40,000 evacuees – sent to 250 shelters • 10 inches of rain in Indiana, Illinois, Missouri. Ohio and Kentucky had CAT 1 Hurricane force winds • 1.3 million homes without power in Ohio as of 25 September • 600,000 customers without power in Kentucky – the largest power outage in state history
Hurricane Ike Stats (continued) • 97.5% of oil production and 95% of natural gas production shut down • 28 of 3,800 offshore platforms destroyed (64 destroyed in Rita – 44 destroyed in Katrina) • Estimated insured losses from Ike -- $16-$20 billon onshore plus $600 million to $1.5 billion for offshore assets • TWIA (Texas Wind Insurance Association) has a $370 million reserve Trust Fund – plus $1.5 billion in reinsurance. Losses to TWIA will exceed $2.2 billion or more • Ike and Gustav will not be a solvency issue for property insurers but is likely to be an “earnings” event for many insurers • Gustav hit two weeks before Ike – Gustav loss estimates exceed $4 billion