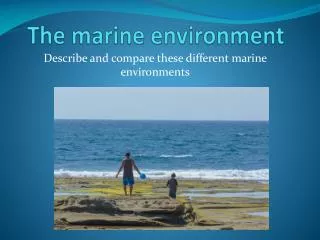
Chapter 10 The Marine Environment
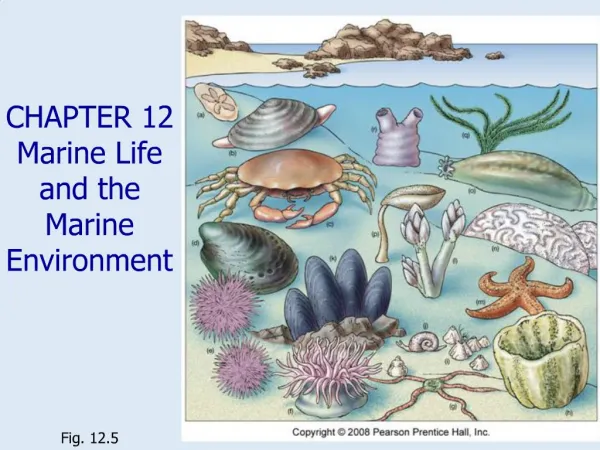
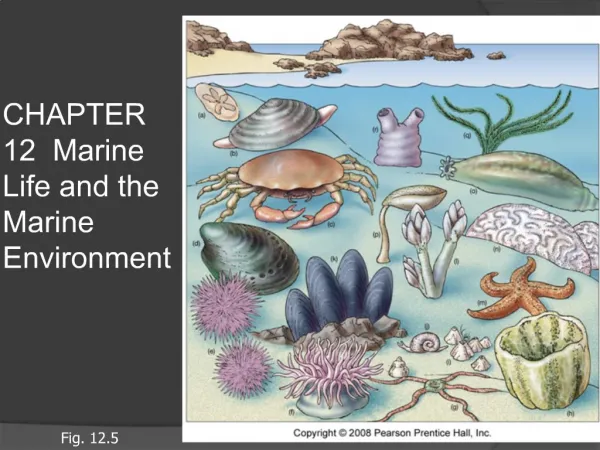
Chapter 10 The Marine Environment. Continental shelf : the submerged edge of a continent . Shelf break : the point where there is a change in slope on the shelf from~0 ° to 2 ° -4 ° . Neritic environment : that part of the ocean that overlies the continental shelves.

Chapter 10 The Marine Environment
E N D
Presentation Transcript
Chapter 10 The Marine Environment
Continental shelf: the submerged edge of a continent. Shelf break: the point where there is a change in slope on the shelf from~0° to 2°-4°. Neritic environment: that part of the ocean that overlies the continental shelves. Oceanic environment: that part of the ocean that overlies the ocean basin.
Ekman Transport Surface currents are deflected by the Coriolis effect. In the northern hemisphere, the causes a clockwise rotation. If the ocean current is regarded as layered, then each deeper layer moves more slowly than the overlying layer. Layers that move slower will be acted on more strongly than those that moved faster. Therefore, the lowest layers are rotated 90°and more to the surface layer.
Upwelling: whereEkman transport causes surface waters to diverge or move away from the coast and deeper (often cold and nutrient-rich) water to be brought to the surface. Downwelling: where Ekman transport causes surface waters to converge or impinge on the coast, displacing surface waters to converge or impinge on the coast, displacing surface water downward thickening the surface layer.
Thermohaline circulation and specific water masses These intermediate and deep ocean water masses are characterized by their temperature and salinity. When two water masses interact, the temperature and salinity of the mixed waters are linearly related to the relative proportions of the contributing water masses.
As might be expected, the different water masses often do not have a unique temperature and salinity, but rather a range of characteristic temperatures and salinities.
Example 10-1 Water samples were collected in the North Atlantic in the depth range 850m to 1500m. The sample collected at 850m had T & S values typical of MIW, whereas the sample collected at 1500m had T & S characteristic of NADW. The temperature and salinity values for the 5 samples are given in the table below. When plotted, the data lie on a straight line, with the NADW & MIW as end members. The other samples represent simple mixtures of MIW & NADW. The numbers in parentheses indicate the fraction of MIW in each sample.
Chemical composition of the oceans Constancy of composition: the ratio among all dissolved elements is constant Normalized to Cl- Salinty: the total amount in grams of solid material dissolved in 1kg of seawater when all the carbonate has been converted to oxide, all the iodine and bromine have been replaced by chlorine, and all organic matter has been completely oxidized. (S ‰ = 1.80655 Cl-o/oo)
Residence time varies by element Residence times = seawater conc. / input rate of element Short residence time elements are highly reactive, and not recycled
Inputs of elements : atmosphere, continental weathering, seawater-seafloor interactions Removal of elements : atmosphere, precipitation, adsorption, reactions with seafloor Atmosphere supplies and removes gases Continents supply major elements Direct precipitation is relatively unimportant Biological removal (Si, Ca) Adsorption onto primarily oxyhydroxides. pH = 8.0, oxyhydroxides have negative charge….so cations are the adsorbed Water cycling through seafloor basalts add some and remove other elements.
Biological controls on seawater composition Redfield ratio, C:N:P= 106:16:1 Expanded redfield ratio include trace elements O2 minima, nutrient maxima
1 f = 1 + 20 20[S]/[R] 1 - g = 20 [D]/[R] + 1 [S] [D] - [R] [R] Only a fraction of the biogenic elements created in the upper ocean is buried in ocean sediments D: deep water conc. S: surface water conc. R: River water conc. Assuming upwelling is 20x river input: g is the fraction of biogenic element removed t = 1600 y / fg t is the residence time
Example 10-2: The following average concentrations, in mmol L-1, were determined for P in the Pacific ocean: surface water = 0.2 and deep water = 2.5. For average river water, P = 0.7 mmol L-1. Calculate f, g,and t for P. f = 1 / 20(([2.5] – [0.2])/[0.7])) + 1 = 0.015 g = 1 – ((20[0.2]/[0.7])/(20[2.5]/[0.7] + 1)) = 0.92 t = 1600 y / (0.015)(0.92) = 115,942 y This tells us that 92% of the phosphorus is removed from the surface waters as biogenic particles, and that over 98% of the phosphorus contained in the organic particles is returned to the water column by decomposition and dissolution. The calculated residence time of P in the ocean is relatively long because it is continually recycled through the oceanic system.
Biolimiting elements: elements that are almost totally depleted in the surface waters. Biointermediate elements: elements that are only partly depleted in the surface waters. Biounlimited elements: elements that show no measurable depletion in the surface waters. Seawater – sediment interactions At seawater pH clay particles have neg. charge At high ionic strength, monovalent cations preferentially exchange for divalent cations (Na+ swaps out for Ca2+) Redox conditions, determined primarily by organic matter availability
Seawater-basalt interactions Mid ocean ridges, range of temperatures Major basaltic minerals olivine (Fe,Mg)2SiO4 pyroxene Ca(Mg,Fe)Si2O6 , (Mg,Fe)SiO3 Ca-plagioclase CaAl2Si2O8 obsidian High Temp reactions: Reactions remove Mg2+ and SO42-, Reactions add Ca2+ , H4SiO4, and K+ Low Temp reactions: Reactions remove Mg2+ and K+, Reactions add Ca2+ , H4SiO4
Seawater chemistry Ionic strength (I) of seawater related to salinity I = (19.92 x S‰) / {1000 - (1.005 x S‰} Alkalinity of seawater should include contributions of other species capable of accepting electrons in addition to the carbonate species Ex: Peng et al. 1987 TA = [HCO3-] + 2[CO32-] + [H2BO3-] + [H3SiO4-] + [H2PO4-] + 2[HPO42-] + 3[PO4-] + [OH-] However, the majority of seawater alkalinity still comes from CO32- and HCO3- . CA (carbonate alkalinity) = HCO3- + 2CO32- The Redfield ratio is C:N:P = 106:16:1.
Alkalinity cont. Photosynthesis DIC decreases Alk stays the same Respiration DIC increases Alk stays the same CaCO3 dissolution DIC increases Alk goes up CaCO3 precip DIC goes down Alk goes down older younger
CH2O + O2 CO2 + H2O CO2 + H2O H2CO3 H2CO3 + H2O H+ + HCO3- HCO3- + H2O H+ + CO32- CaCO3(calcite) Ca2+ + CO32-
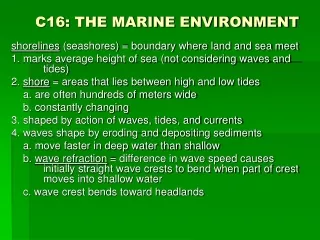
Calcite, aragonite solubility and the CCD Saturation horizion = depth at which ocean becomes undersaturated with respect to calcite and aragonite Lysocline = depth where waters are increasingly undersaturated with respect to calcite and aragonite CCD = depth below which, calcite and aragonite is so undersaturated that calcareous sediments won’t accumulate on the seafloor.
Calcite, aragonite solubility and the CCD Ca2+ can be calculated using salinity Ca2+ = 0.01028(S/35) Surface waters are strongly oversaturated with respect to calcite Aragonite more soluble than calcite by a factor of 50 Saturation state for both is essentially a function of CO32- conc. Less CO32- in Pacific (see Example 10-3) = shallower CCD in Pacific
Buffering capacity of seawater includes contributions from the carbonate system and boric acid Maximum buffering capacity range for the boric acid and carbonate systems are not within the normal pHs found in seawater. Although seawater is well-buffered on long timescales by reactions with calcite, pH can vary on the short-term (remember photosynthesis versus respiration)
Trace metals in seawater Sources: hydrothermal (Mn, Fe, Ba, Li, Rb) rivers atmosphere Sinks: removed by particles (either lithogenic, or biogenic) Open ocean, particles are biogenic Coastal ocean, particles both biogenic and lithogenic Metals removal by biology: Uptake, Redfield : C:N:P:Fe:Zn:Mn:Ni:Cd:Cu:Co:Pb 180:23:1:0.005:0.002:0.001:0.0005:0.0004:0.0002:0.00004 Metals enriched in shell material (Ba, Sr, Cu, Ag, Zn, Pb, Ti, Cr, Mn, Fe, Ni) EF = Me conc. in biogenic material / Me conc. in sewater Ligand complexes with secreted organic material
Enrichment factor (EF) =Metal concentration in biogenic material Metal concentration in seawater
Metals removal by adsorption and precipitation Sinking particles composed of conglomerates of: organic matter, oxyhydroxides, clay minerals, shell Particles have net negative charge Metals are scavenged by particles Conservative vs. non conservative distributions Figure 10-18. Schematic plot of concentration versus salinity. Species A shows conservative behavior. Species B and C show nonconservative behavior. Internal processes are adding species B to the seawater. Internal processes are removing species from the seawater. production Mixing line uptake
Vertical profiles Biolimiting trace metals will be depleted in surface waters If a trace element is associated with organic matter, there will be a mid water column maxima If a trace element is associated with CaCO3 shell material there will be a deep water maxima (CCD) If a trace element is associated with opaline shell material, its concentration will be correlated to Si
Global distribution of Methane Hydrates It is estimated that there is a total 1.2x10¹⁷ m3 of methane gas (expanded to atmospheric conditions) or equivalently 74,400 Gt of CH4 in ocean hydrates, which is three orders of magnitude larger than worldwide conventional natural gas reserves. Of this, it is estimated 4.4x10¹⁶ m3 of methane expanded to STP exists on the continental margins.
Marginal Marine Environment Water and salt balances Water balance : Ti + P = To +E Tidal inputs plus precipitation = tidal outputs plus evaporation Salt balance: TiSi = ToSo Tidal inputs times ocean salinity = tidal outputs times basin salinity Combine: Ti = [So(E-P)] / (So – Si) To = [Si(E-P) / (So-Si)]
Brine Sill Sill
Principal types of estuaries based on physiographic characteristics.
Water column chemistry in marginal or estuarine waters Mixing of fresh and salt waters impact many of the parameters that govern mobility of elements (e.g. adsorption, redox, aqueous complexes, pH etc) Examples: Fe and Al precip out in seawater due to higher pH Increased ionic strength leads to flocculation of colloids (turbidity max) Redox sensitive phosphate, iron oxyhydroxide reactions Use salinity vs. species mixing curves as a first indicator of reactivity Adsorption Metals will associate with dissolved organic matter and suspended particulate matter. Increased dissolved organic matter will decrease the amount of metals scavenged by suspended particulate matter In general: an increase in salinity will release adsorbed metals into solution but enhance adsorption of organic species.
Redox There are a number of redoxclines in coastal marine / esturarine settings Low redox – Fe, Mn, Co soluble Cd, Cu, Zn insoluble (ppt as sulfides, or sulfide complexes stuck to silicate particles) High redox – Fe, Mn, Co exist as insoluble metal oxyhydroxides
Biomarkers in sediments Enrichment above 1800’s levels Retain original source-specific Structure Combined with radioisotopes PAH fingerprints