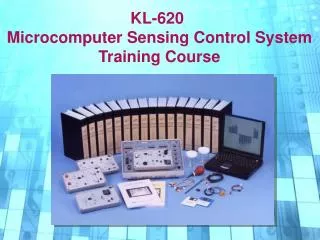
KL-620 Microcomputer Sensing Control System Training Course
KL-620 Microcomputer Sensing Control System Training Course. Unit 0 : KL-62001. Main Unit. Unit 13 : KL-64013. Unit 9 : KL-64009. Unit 1 : KL-64001. Unit 5 : KL-64005. General Sensors (I). Temp I (AD590) Humidity. CDS Photovoltaic. Level (Water). Unit 2 : KL-64002.

KL-620 Microcomputer Sensing Control System Training Course
E N D
Presentation Transcript
KL-620 Microcomputer Sensing Control System Training Course
Unit 0 : KL-62001 Main Unit Unit 13 : KL-64013 Unit 9 : KL-64009 Unit 1 : KL-64001 Unit 5 : KL-64005 General Sensors (I) Temp I (AD590) Humidity CDS Photovoltaic Level (Water) Unit 2 : KL-64002 Unit 6 : KL-64006 Unit 10 : KL-64010 Unit 14 : KL-64014 General Sensors (II) Infrared Ultrasonic V/F Converter Fiber Optic Unit 3 : KL-64003 Unit 7 : KL-64007 Unit 11 : KL-64011 Unit 15 : KL-64015 General Sensors (III) LVDT Pressure Strain Gauge F/V Converter Unit 4 : KL-64004 Unit 8 : KL-64008 Unit 12 : KL-64012 Unit 16 : KL-64016 Gas/Smoke Ethanol Hall Current Proximity Temp II (PT100) Rotation Angle
Unit 0 : KL-62001 Main Unit In this Unit, the operation of each block on Main Unit will be introduced. After study complete, users are able to use KL-62001 as measurement and assist tool for KL-620 experiments. 1. System Test 6. Alarm Amplifier Test 2. DCV Measurement (Manual) 7. Comparator Test 3. DCV Measurement (Chip) 8. Differential Amplifier Test 4. DCV Measurement (PC) 9. Instrumentation Amplifier 5. D/A Converter Test 10. Other MCU Function Test Menu
System Test Objective: To understand how to self test Single Chip and EPROM. Blocks to be demonstrated: Thumbwheel Switch Status Display Single Chip Out Control 2 Out Control 3 EPROM Back
Procedure: • Turn off the power. Connect the wires as shown in next slide. • Turn on the power. If the speaker beep 4 times and the Status Display shows “1”, it means that the Single Chip and EPROM work functionally. • Remove Control2 from Ground. The Status Display will display the value shown on Thumbwheel Switch. • Adjust the Thumbwheel Switch below 4095. The Status Display will show the current value of the Thumbwheel Switch. • Adjust the Thumbwheel Switch over 4095 The speaker will alarm and the Status Display shows “0000”.
Control2 GND Control3 GND
DCV Measurement (Manual) Objective: To understand how to use Potentiometer. To use DC Voltage Meter to measure DC Voltage manually. Blocks to be demonstrated: DC Power +12V, -12V Status Display MODE Button Range Button Select / Manual Potentiometer Back
Procedure: • Turn off the power. • Connect the wires as shown in next slide. • Turn on the power. • Press Range button twice. Select the measuring range of DCV ( -20V ~ +20V) • Rotate the Potentiometer. The output voltage at VR2 will display at Status Display section (-12V ~ +12V) . Discussion: When connects MANUAL to the GND, Status Display Section acts as DC Voltage Meter.
Connect to GND +12V VR3 +Input VR2 Manual GND -12V VR1
DCV Measurement (Chip) Objective: Use A/D Converter, Single Chip and Status Display to measure DC voltage Blocks to be demonstrated: DC Power +5V, GND Status Display MODE Button Range Button A/D Converter Select / Chip Potentiometer Back
Procedure: • Turn off the power. • Connect the wires as shown in next slide. • Turn on the power. • Press Range button twice. Select the measuring range of DCV ( -20V ~ +20V) • Rotate the Potentiometer. The output voltage at VR2 will display at Status Display section (0V ~ +5V) . Discussion: Warning!! The max voltage input to ADC is 5V. • When connecting CHIP to the GND, the analog signal received from A/D Converter will send to single chip for decoding and output to 7 segment display. • When sending the analog signal to the PC, the signal should be converted to digital format. As the result, this technique will be used when connecting the main unit to the PC. Check next exercise.
+5V VR1 A/D IN VR2 GND VR1 Chip GND
DCV Measurement (PC) Objective: Use computer interface to acquire and record DC voltage Blocks to be demonstrated: DC Power +5V, GND RS-232C A/D Converter Select / Chip Potentiometer Back
Procedure: • Turn off the power and connect the wires as shown in next slide. • Connects RS-232C port to PC COM port by using K&H RS-232 Cable. • Turn on the power and launch the KL-620 software. • Press the [Acquire] button. Start to record the DC voltage. • Rotate the Potentiometer. The output voltage at VR2 will display at software panel. Warning!! The max voltage swing input to ADC is -5V ~ +5V. Discussion: When connecting CHIP to the GND and CTRL pin to GND, the analog signal received from A/D Converter will send to PC through RS-232 interface.
+5V VR3 Connect to PC COM1 CTRL GND A/D IN VR2 GND VR1 Chip GND
KL-620 Software Interface for Data Acquisition Load saved data Graphic and Cursor control panel Save data in Excel format Data stored in Table Press acquire button to start acquire data Setup trigger level for background color Change Y-axis Name and Scale Setup Acquire Frequency, Number and Gain Current, Min, and Max value
D/A Converter Test Objective: Use DCV to measure the voltage converted from D/A Converter Blocks to be demonstrated: Thumbwheel Switch Status Display D/A Converter Select / Manual Back
Procedure: • Turn off the power and connect the wires as shown in next slide. • Turn on the power. • Press Range button twice Setup DCV measuring range (-20V ~ +20V) • Adjust Thumbwheel Switch below 4095, for example 3512 Status Display will show close to 3.512, meaning that the output voltage of DA Converter is 3.512 Volt. • Adjust Thumbwheel Switch above 4095 Status Display will show close to 0.000 and speaker start beeping. Discussion: The digital output of thumbwheel switch (12-bit) is connected to 12-bit D/A Converter DA0~DA11 and convert to DC voltage. The scale for converting is 1 bit = 0.001V i.e. (0000~4095 => 0.000~4.095V)
+Input OUT+ Connect to GND Manual GND
Alarm Amplifier Test Objective: Understand the connection and function of alarm amplifier block Blocks to be demonstrated: DC Power GND, +5V Alarm Amplifier Potentiometer Back
Buzzer Signal Input From Single Chip • Procedure: • Turn off the power and connect the wires as shown in next slide. • Turn on the power. • Rotate the Potentiometer When the applied voltage is higher than 0.7V, the buzzer will be ON. Discussion: The schematic of the Alarm Amplifier block is shown below. When the applying voltage to Signal Input of Alarm Amplifier is above around 0.7 volt, transistor will be ON and the buzzer will start alarming.
+5V VR3 GND VR1 SIN. IN VR2
Comparator Test Objective: Understand the connection and function of comparator block Blocks to be demonstrated: DC Power GND, +5V,+12V Comparator Select / Manual Potentiometer Back
V- Vo V+ • Procedure: • Turn off the power and connect the wires as shown in next slide. • Turn on the power. • Press Range button twice (20V range) • Rotate the Potentiometer When V+ > V-, Vo outputs a positive 10 volt. When V- > V+, Vo outputs a negative 10 Volt. Discussion: The schematic of the Comparator is shown below.
+12V VR3 +5V V- +Input Vo Connect to GND GND VR1 V+ VR2 Manual GND
Differential Amplifier Test Objective: Understand the connection and function of differential amplifier block. Blocks to be demonstrated: DC Power +12V, +5V,-5V Differential Amplifier Select / Manual Back
I 10k V- 10k Vo I V+ 10k V+ 2 10k • Procedure: • Turn off the power and connect the wires as shown in next slide. • Turn on the power. • Select Range button to 20V range The Status Display shows 7 (Volt). • Connects V+ to DC -5V and V- remains connecting to DC +5V The Status Display shows -10 (Volt) Discussion: The output voltage of differential amplifier is equal to V+ - V-. However due to the power supplied limit of amplifier, the maximum difference is equal to 12 Volt. The schematic of the differential amplifier is shown and explained below.
+12V V+ +5V V- +Input Vo Connect to GND Manual GND
Instrumentation Amplifier Test Objective: Understand the connection and function of instrumentation amplifier block. Blocks to be demonstrated: Thumbwheel Switch Instrumentation Amplifier D/A Converter Select / Manual Potentiometer Back
Vi+ R3:10k VR1 R1:100k R2:10k Vo VR2 VR R1:100k R2:10k VR3 R3:10k Vi- • Procedure: • Turn off the power. • Use multi-meter and adjust Potentiometer until the resistance between VR2 and VR3 is equal to 40k Ohm. • Setup Thumbwheel Switch to be 0200 D/A Converter OUT+ = 0.2 Volt • Connect wires as shown in next page. • Turn on the power. • Select Range button to 20V range Status Display shows 1.2V Discussion: The schematic of the instrumentation amplifier block is shown at right side, where = 6
OUT+ V- GND V+ +Input Vo VR1 VR1 Connect to GND VR3 VR3 VR2 VR2 Manual GND
Other MCU Function Test Objective: To understand the Out Control pin1 and pin4 of MCU block Blocks to be demonstrated: DC Power +5V, GND Thumbwheel Switch Status Display A/D Converter Single Chip Out Control 1 Out Control 4 Alarm Amplifier Select / Chip Potentiometer Back
Procedure: • Turn off the power. Connect the wires as shown in next slide. • Setup Thumbwheel Switch to be [1000] Setup Alarm level equal to 1.221 Volt. (See discussion below) • Turn on the power. • Select Range button to 20V range • Adjust the Potentiometer so that the Status Display shows higher than 1.221 (Volt) Out Control 1 outputs a continuous pulse (pulse width = 0.5 sec) to the alarm amplifier and enable the alarm. • Adjust the Potentiometer so that the Status Display shows lower than or equal to 1.221 (Volt) Out Control 1 outputs a LOW state, no sound outputs from alarm. • Remove Out Control 1 from Alarm Amplifier SIN. IN • Connect Out Control 4 to Alarm Amplifier SIN. IN • Adjust the Potentiometer so that the Status Display shows higher than 1.221 (Volt) Out Control 4 outputs a LOW state. • Adjust the Potentiometer so that the Status Display shows lower than or equal to 1.221 (Volt) Out Control 4 outputs a HIGH state and alarm amplifier starts alarming.
+5V VR3 A/D IN VR2 Out Control1 SIN. IN GND VR1 Chip GND
Scaled Value Preset Level Formula : = x 5000 4095 Discussion: Scaling the Preset level from 0000 ~ 4095 to 0000~5000 Preset Level 0000~4095 Scaled Level 0000~5000 The range of the preset level is from 0000~4095. The range of the voltage level output from AD converter is from 0V~5V (0000~5000) As the result, when the preset level is set to 1000 and when the AD In voltage exceed 1221, the alarm beeps. (Outputs from Control 1). Another example, when the preset level is set to 3000 and when the AD In voltage exceed 3663, the alarm beeps. (Outputs from Control 1). = 0 1000 2000 3000 4000 4095 0000 1221 2442 3663 4884 5000 = = = = =
Unit 1 : KL-64001 General Sensors (I) You have learned how to use Main Unit KL-62001 as a measurement and assist tool from previous Unit. In this Unit, 4 different types of common sensors are introduced. The connections of the modules to the Main Unit will not be introduced. Any questions regard to the Main Unit connections can be referred to Unit 0. 1. Photo Transistor 2. Photo Interrupter 3. Magnetic Hall Effect (Digital) 4. Magnetic Hall Effect (Analog) Menu
Window Wire Chip Lead wire Photo Transistor Structure: Symbol: C E The electrons that are generated by photons in the base-collector junction are injected into the base, and this current is then amplified by the transistor operation. i.e., The light striking the base replaces what would ordinarily be voltage applied to the base – so, a phototransistor amplifies variations in the light striking it. Back
Ic photons Iλ Ic WHEN Iλ Photons Vo1 Ic WHEN Iλ Photons Vo1 Circuit Explanation:
Experiment Procedure: • With power off, connect Vo1 to the Main Unit DCV INPUT+. • Turn on the power. • Cover the phototransistor with hand and record the output voltage Vo1? • Lighten the phototransistor with fluorescent lamp and record the output voltage Vo1? • What is the relation between the output voltage and the distance between light source and phototransistor? Note: If you don’t know how to use DCV, please check Unit 0 Answers: 3. ~ 5 Volt 4. 0.1 V ~ 4.0 V, depends on the magnitude of the light source. 5. The longer the distance, the higher output voltage
Barrier Emitter + + Detector E D Fixed hole Lead wire Photo Interrupter Structure: Symbol: A common implementation involves an LED and a Phototransistor, separated so that light may travel across a barrier but electrical current may not. When an electrical signal is applied to the input of the photo interrupter, its LED lights, its light sensor then activates, and a corresponding electrical signal is generated at the output. Back
Circuit Explanation: Ic Vo2’ In normal situation: Detector receives light signal from LED Vo2’ = LOW Vo2 = LOW When an object block the light bean: Collector current Ic decreases Vo2’ = High Vo2 = High The two inverters act as a wave shaper and Schmitt trigger Latch.
Answers: • 3. nothing happened • 4. start alarming • 5. Vo2’ Vo2 • Experiment Procedure: • With power off, connect Vo2 to the SIN. IN of Alarm Amplifier of on Main Unit. • Turn on the power. • What’s the status of the alarm when nothing block the light bean? • What’s the status of the alarm when an object blocks the light bean? • Use oscilloscope to compare the wave shape of Vo2’ and Vo2 Note: If you don’t know how to use DCV, please check Unit 0
Output Supply Ground Magnetic Hall Effect (Digital) Structure: Symbol: Hall IC Pinning is shown from brand side The linear Hall-effect sensor detects the motion, position, or change in field strength of an electromagnet. The output null voltage is nominally one-half the supply voltage. A south magnetic pole, presented to the branded face of the Hall effect sensor will drive the output higher than the null voltage level. A north magnetic pole will drive the output below the null level. Back
The voltage of Vo3’ is affected by the pole and magnitude of the magnetic field. When South pole approaches to the sensor Vo3’ When North pole approaches to the sensor Vo3’ The two inverters act as a wave shaper and Schmitt trigger Latch. Circuit Explanation: Vo3’ Magnet
Experiment Procedure: • With power off, connect Vo3’ to DCV. • Turn on the power. • What’s the value of Vo3’ shown on DCV? • Move the magnet (North pole face to the device) toward the Hall IC and observe the value of Vo3’ shown on DCV. • Move the magnet (South pole face to the device) toward the Hall IC and observe the value of Vo3’ shown on DCV. • Replace the measure point from Vo3’ to Vo3, and repeat step 4 • Replace the measure point from Vo3’ to Vo3, and repeat step 5 • Answers: • 3. ~2.5 Volt • 4. 2.5V ~ 4.1V, the closer the magnet, the higher output voltage. • 2.5V ~ 1.1V, the closer the magnet, the lower the output voltage. • 5 Volt • 0 Volt
Magnetic Hall Effect (Analog) Structure: Symbol: Hall Element Vin GND Vout1 Vout1 Vout2 Vin Vout2 GND The Hall element provides an output voltage that is proportional to the magnetic filed which it is exposed. The sensed magnetic field can be either positive or negative. As a result, the output of the amplifier will be driven either positive or negative Back
Circuit Explanation: Vout1 Vout2 Magnet The voltage of Vout1 and Vout2 is affected by the pole and magnitude of the magnetic field. When South pole approaches to the sensor Vout1 Vout2 Vo4 When North pole approaches to the sensor Vout1 Vout2 Vo4 Variable resistor R9 is used for offset adjustment.
Experiment Procedure: • With power off, connect Vo4 to DCV. • Turn on the power. • Adjust variable resistor R9 so that Vo4 is equal to 0 Volt. • Move the magnet (North pole face to the device) toward the Hall IC and observe the value of Vo4 shown on DCV. • Move the magnet (South pole face to the device) toward the Hall IC and observe the value of Vo4 shown on DCV. Answers: 4. Vo4 = 0 ~ 6 Volt The closer the magnet, the higher output voltage (positive direction). 5. Vo4 = 0 ~ -6 Volt The closer the magnet, the higher output voltage (negative direction).
Unit 2 : KL-64002 General Sensors (II) 5. Pyroelectric Detector 6. Reed Switch 7. Thermistor 8. Mercury Switch Menu
Pyroelectric Detector Symbol: Structure: D Filter Window Drain Source Gate G S The pyroelectric sensor is made of a crystalline material that generates a surface electric charge when exposed to heat in the form of infrared radiation. When the amount of radiation striking the crystal changes, the amount of charge also changes and can then be measured with a sensitive FET device built into the sensor. The sensor elements are sensitive to radiation over a wide range so a filter window is added to the package to limit incoming radiation to the 8 to 14μm range which is most sensitive to human body radiation. Back